What proportion of urban journeys are made by public transport? Estimating modal share using mobile network and ticketing data
Every day, millions of people decide how to travel around their city: by car, by bike, by bus or underground or on foot. Understanding the proportion of people who choose public transport and between which zones of the city —a metric known as ‘modal share’— is one of the most critical questions for any transport operator or authority. However, obtaining this information has traditionally been a difficult, expensive, and time-consuming process. Against this backdrop, and recognising the importance of such data for developing a transport system adapted to the actual needs of the population, we at Nommon have developed a methodology that enables us to easily calculate the number of people opting for each mode of transport, right down to the neighbourhood level. How? By combining mobile network data with public transport ticketing data.

The challenge of evolving mobility demand
Public transport demand is changing rapidly, driven by new and shifting working patterns and consumer behaviour. As travel habits continue to evolve, existing public transport provision does not always keep pace. According to the latest Mobility Institute barometer, almost one in five respondents in Madrid and Barcelona cite poor connectivity and slow journey times as the main reasons for not using public transport. These are not isolated shortcomings but evidence of a structural mismatch between transport supply and constantly evolving demand.
To address this imbalance, transport planners need to understand the cities modal share, or in other words, the proportion of journeys made by each mode of transport, zone by zone. This is the same indicator used by retailers such as Inditex and Amazon to measure their market share. The difference is that, while the retail sector has spent years refining this type of analysis, public transport has traditionally relied on mobility surveys that are expensive, infrequent and limited in both spatial and temporal resolution. To overcome these limitations, Nommon developed a methodology based on combining two continuously updated data sources with a high level of spatial and temporal detail: mobile network data and ticketing data.
The solution: big data and artificial intelligence for estimating modal share
The proposed methodology combines two large-scale data sources: mobile network data and ticketing data. Both are processed through the analytical engines of two Nommon solutions. On the one hand, Mobility Insights uses anonymised mobile network data to reconstruct the overall mobility of the population. On the other hand, WiseTransit transforms public transport smart card validation records into complete passenger journeys, revealing how passengers travel across the system.
Individually, each of these data sources provides only part of the picture. Combined, however, they make it possible to estimate what proportion of all journeys within an area is made by public transport.This data fusion is not a minor challenge. Mobile network data and ticketing data do not describe journeys in the same way. Mobile network data captures complete door-to-door movements, but with a level of spatial accuracy that varies according to the density of the mobile network in each area. Public transport journeys, by contrast, are accurately anchored to boarding and alighting stops, but do not capture the walking stages to and from those stops. Before the two datasets can be compared, they must first be translated into a common analytical framework.
At Nommon we do this in both directions. For public transport journeys, we define the catchment area of each stop and use the distribution of mobile network journeys within that area to reconstruct the complete door-to-door journey. For overall mobility, we assign each journey an allowable displacement margin that reflects the accuracy of the mobile network data in that location, narrowing the range of plausible origins and destinations without assuming in advance which one is correct.
Once the two datasets have been harmonised, the core of the methodology is an optimisation model that operates at the level of individual journeys rather than on origin-destination matrices that have already been aggregated by zone. This is a deliberate design choice. Adjusting aggregated volumes would shift entire groups of journeys without indicating why, whereas working at the individual journey level ensures that every adjustment is justified, traceable and reversible.
The model applies an iterative heuristic designed to smooth abrupt and unjustified changes in modal share between neighbouring zones, which typically reflect inconsistencies between the datasets rather than genuine travel behaviour. To achieve this, it reassigns the origin or destination of a journey only where the reassignment is geographically plausible, remains within the allowable displacement margins, and improves the overall consistency of the dataset without introducing new imbalances elsewhere.
Only once this process has been completed are individual journeys aggregated by zone and time period to produce the final matrices: total mobility, public transport demand and, by combining the two, modal share. Performing the adjustment before aggregation, rather than afterwards, produces a level of consistency that is significantly higher than would be achieved by directly comparing the aggregated data from each source.
Testing the methodology in an urban environment
Nommon tested this methodology on several projects. As an example, we present the case of a medium-sized Spanish city with a radial bus network organised around the city centre, a network structure commonly found in many Spanish cities. Combining the two datasets produced three layers of information: total mobility for each origin-destination (OD) zone pair, the public transport demand captured by each OD pair, and its corresponding modal share.
Using these three indicators, we developed a simple impact measure: an OD pair becomes a priority where overall travel demand is high but relatively few journeys are made by public transport. This makes it possible to distinguish between OD pairs with high travel volumes that are already well served and those where public transport is failing to capture potential demand, the real opportunity for growth. This distinction is shown in Figure 1, where each point represents an OD pair according to its overall travel demand and modal share. In the chart, priority OD pairs are highlighted in red under the label ‘high impact’.
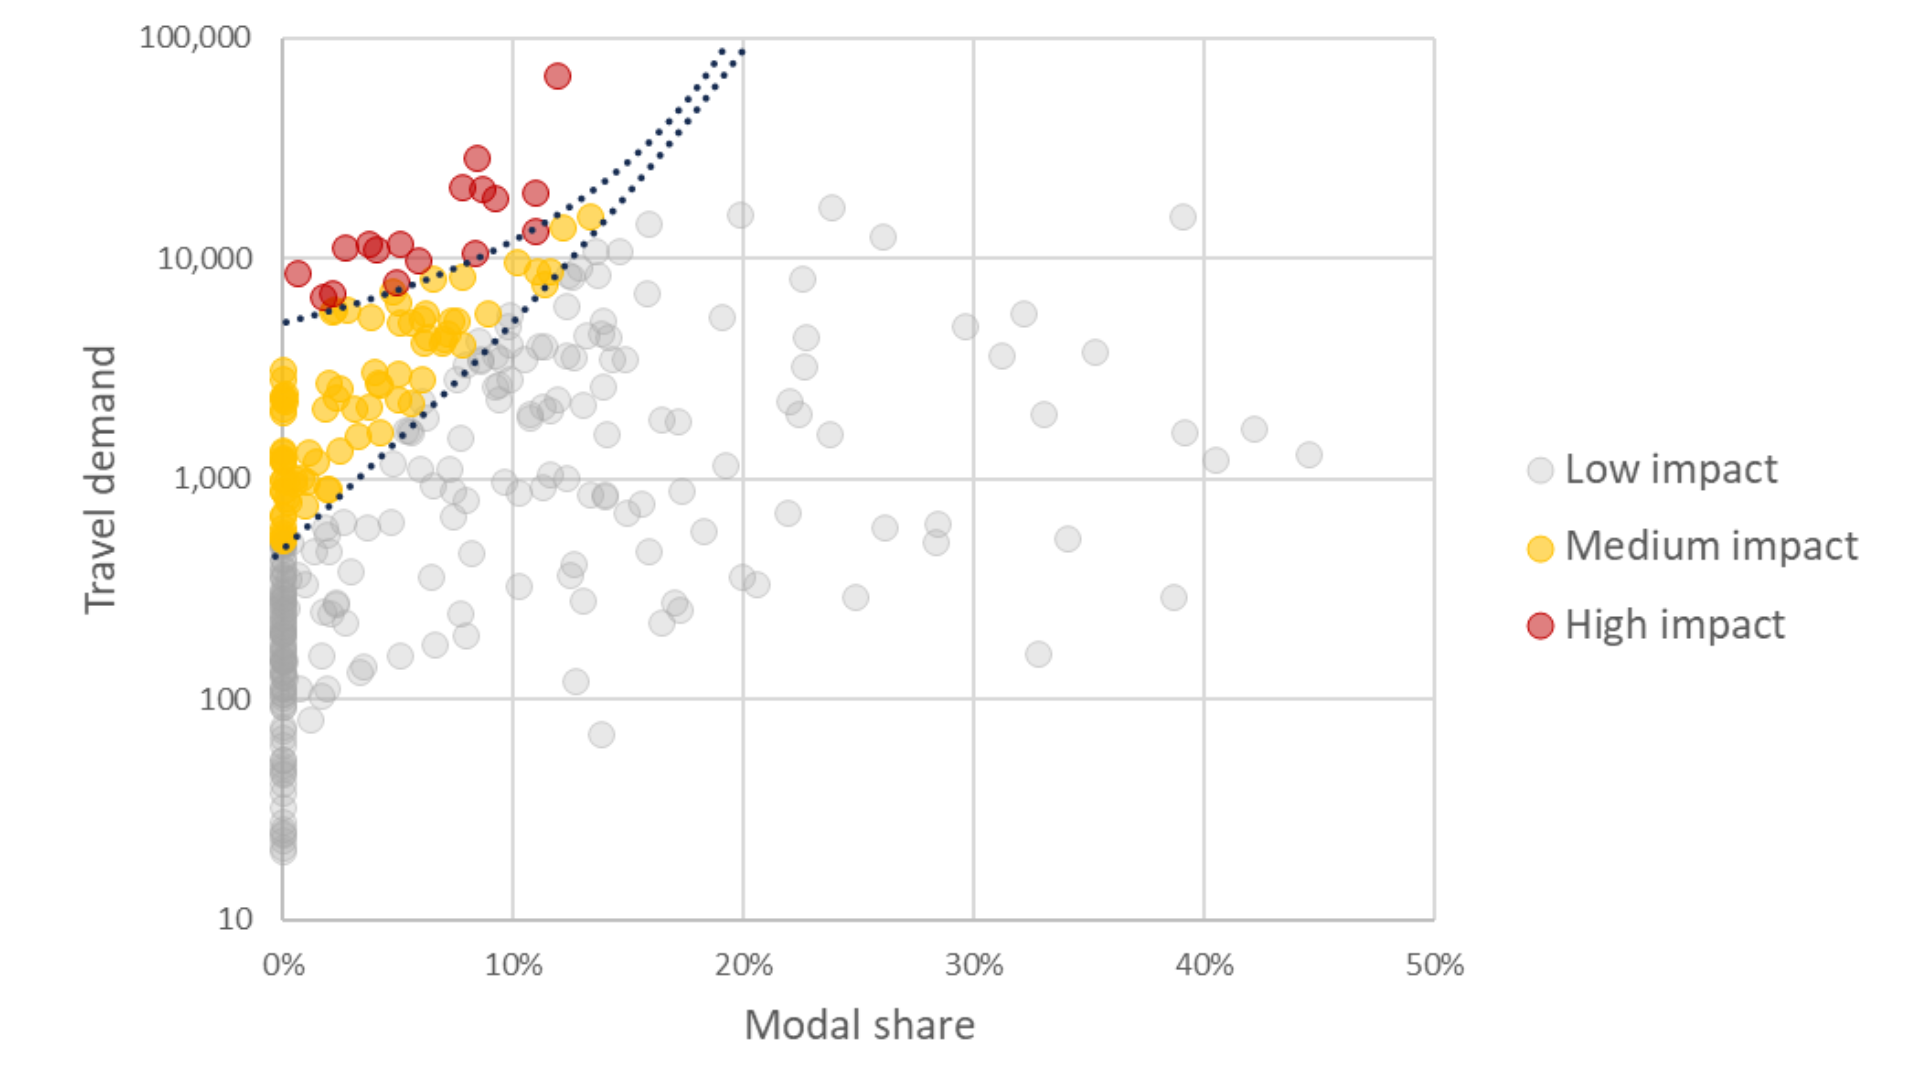
When these results were mapped, a clear pattern emerged: the OD pairs with the greatest potential—that is, those combining high mobility volumes with a low public transport modal share— were concentrated in the southern arc of the city (see Figure 2), precisely where the bus network provides fewer direct connections. This is the logical consequence of a radial network design: journeys between the city centre and the outskirts are generally well served, but travelling between peripheral neighbourhoods often requires passengers to change buses in the city centre.
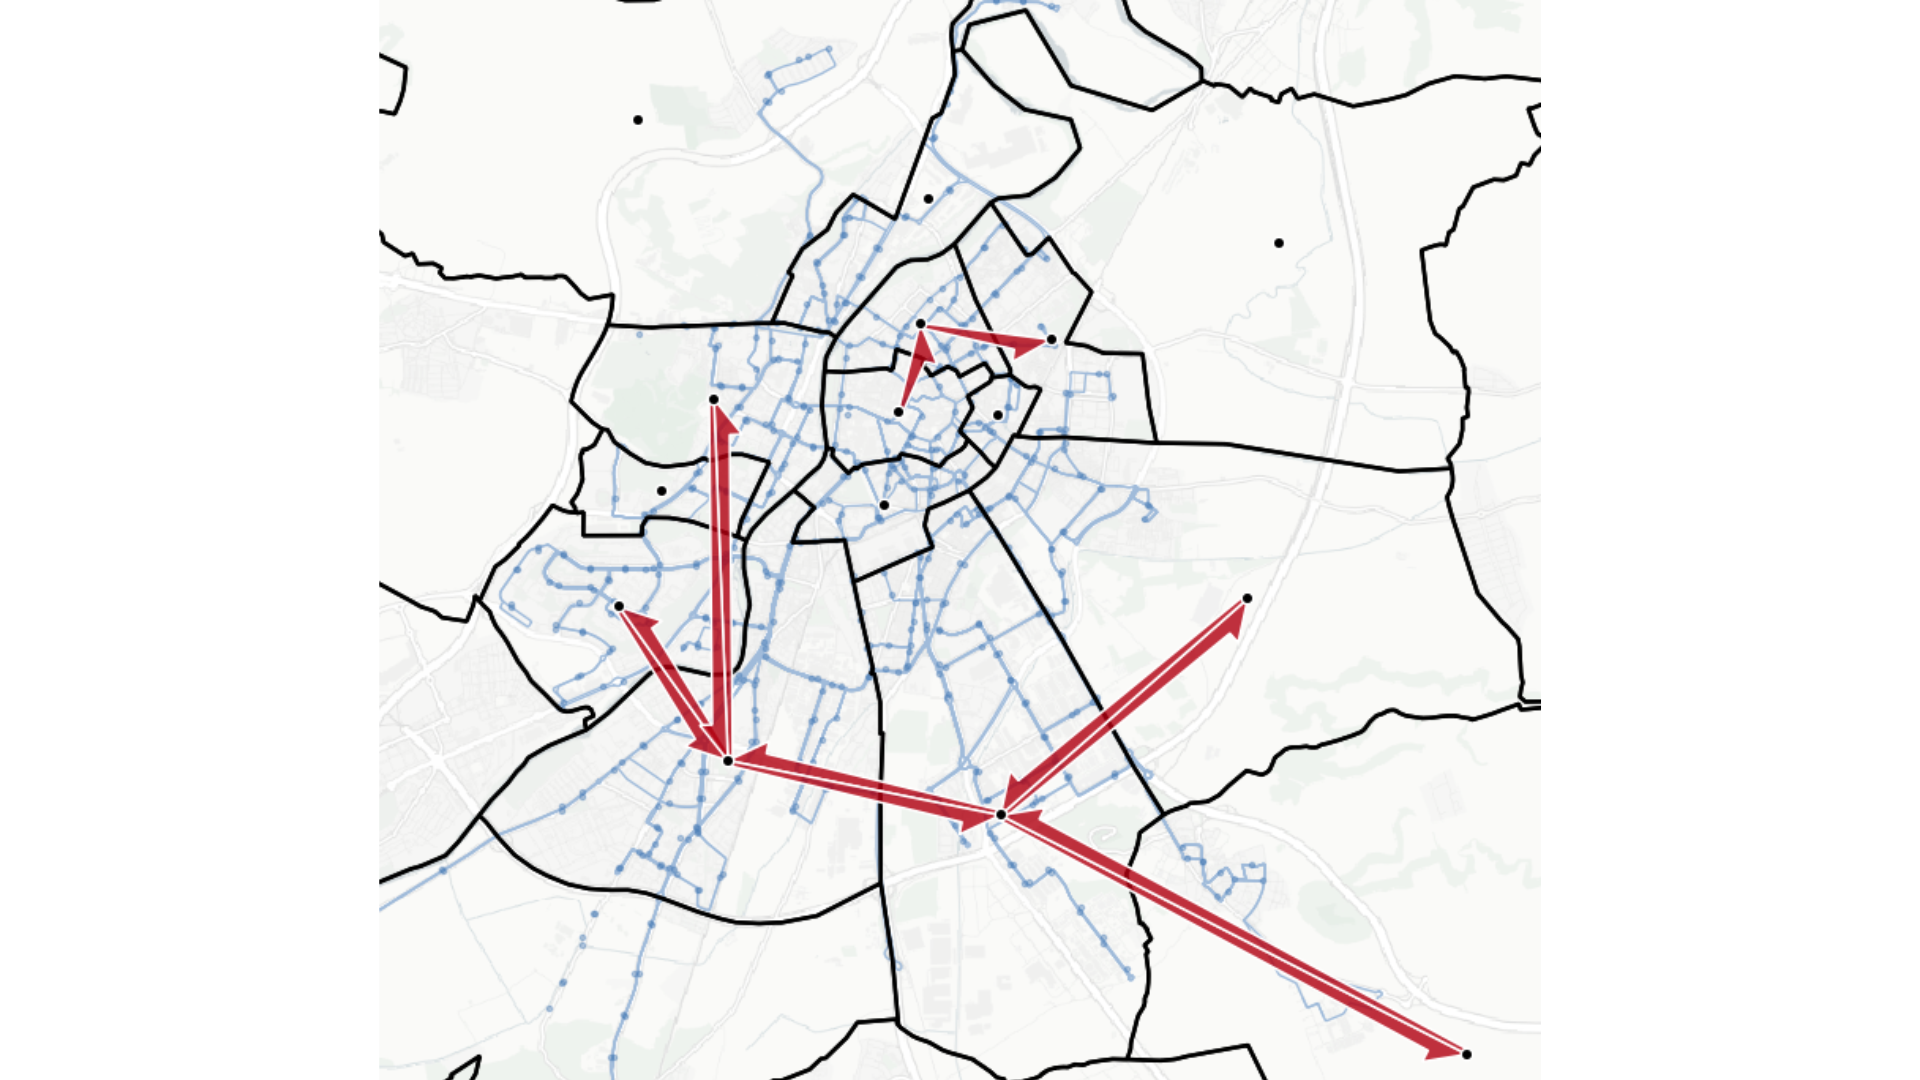
The findings provide an important insight for transport planners: a lower modal share does not necessarily mean that residents prefer travelling by car, rather, it often indicates that they are not being offered a competitive public transport alternative in terms of journey time and the number of interchanges required. This distinction fundamentally changes the appropriate planning response, shifting the focus from simply adjusting timetables and routes to introducing Demand Responsive Transport (DRT) services in peripheral areas where conventional fixed-route services are unlikely to be viable.
A new era of transport planning: precision and continuous updates
This case study demonstrates that combining mobile network and ticketing data provides something that traditional mobility surveys cannot: high spatial and temporal resolution together with continuous updates. This makes it possible to move beyond annual or seasonal averages and analyse specific days to understand how modal share evolves under different conditions. For example, comparing a weekday with a public holiday, a day affected by network disruption, or a major event in the city. Rather than providing only a snapshot of travel behaviour, the methodology can be applied repeatedly over time to assess whether a new route, a change in service frequency or an infrastructure investment genuinely succeeds in increasing public transport modal share.
Looking ahead, this capability opens the door to establishing modal share benchmarks based on different city characteristics, such as size, density and network structure. Authorities and operators will then be able to compare the systems performance with that of similar cities and set realistic, evidence-based improvement targets.
At a time when urban mobility is evolving more rapidly than ever, understanding where public transport stands today is the first step towards designing networks that better meet the needs of both existing passengers and those who have yet to choose public transport.