Monitoring travel demand in Bogotá and Buenos Aires during the pandemic
The COVID-19 crisis had a severe impact on public transport ridership across the globe, compromising the financial viability of transit services. In order to help Latin American cities cope with this challenge, the World Bank selected Nommon to develop a methodology to monitor travel demand patterns based on the exploitation of geolocation data from mobile devices. The methodology was demonstrated in Bogota, Medellín and Buenos Aires, in close collaboration with local transport authorities. The project, which combined Nommon’s Mobility Insights and WiseTransit solutions, provided a detailed knowledge of how the pandemic disrupted mobility patterns, with particular focus on public transport demand.
Briefing
Public transport is often considered as the backbone of sustainable urban mobility. The impact of the COVID-19 crisis on public transport demand, driven by social distance measures and perceived contagion risk, has been a major challenge for transport authorities and operators. Latin American cities are not an exception: while demand decreased by 60-90% in most cities during 2020 and reduced fare revenues, operating costs were significantly higher.
The World Bank (WB) was interested in helping Latin American cities delve into the causes and consequences of the decline in transit ridership. The WB identified that the increasing availability of geolocation data is an opportunity for the mobility sector to closely monitor the evolution of travel demand patterns, and that transport planners need validated frameworks to effectively take advantage of such opportunity. In 2021, the WB trusted Nommon to develop a methodology that could be adopted by any Latin American city to calculate travel demand indicators using the best possible combination of the wide variety of data sources available for each city, including mobile network data, public transport smart card data and mobility surveys, among others. The WB engaged the cities of Buenos Aires, Medellín and Bogota as case studies where the developed methodology could be demonstrated.
“Geolocation data opens great opportunities for a better understanding of urban mobility patterns. The methodology developed by Nommon allowed the World Bank to support Latin American cities in leveraging novel data sources, in a moment where the region required up-to-date information to explore the latest trends that are reshaping the transport sector.”
Aiga Stokenberga, Senior Economist, Transport Global Practice at World Bank.
Solution
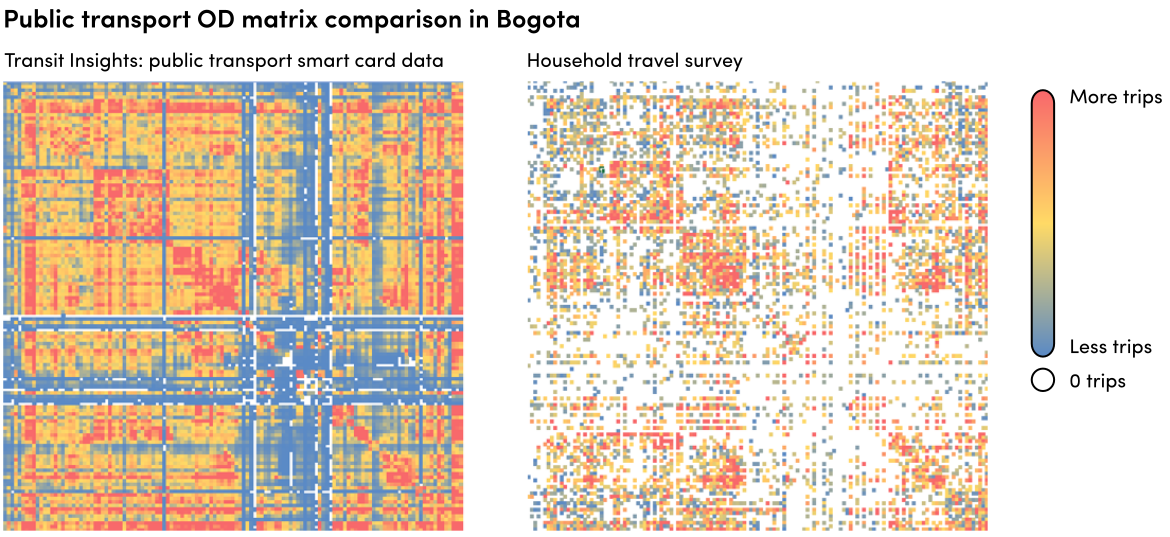
Nommon designed a framework for cities to monitor their travel demand patterns based on two of its mobility analytics solutions: Mobility Insights, which exploits anonymised mobile network data to obtain origin-destination matrices and other travel demand indicators covering all trips (regardless of the mode chosen by the traveller); and WiseTransit, which mines public transport smart card data to reconstruct trip chains in the public transport system and obtain origin-destination matrices for these services.
The methodology addresses one of the key challenges when analysing urban mobility patterns from geolocation data: the identification of the transport mode chosen by each traveller. Mobile network data offers an unprecedented level of detail on trip generation and distribution patterns, but it is often not enough to characterise mode choice in urban environments as, given its spatiotemporal resolution, a single sequence of mobile registers is often compatible with many mode options. The framework provides three alternative methods to overcome this challenge: (i) implement WiseTransit to obtain origin-destination matrices of the public transport system, which then serve as a reference for assigning trips to public transport services; (ii) train machine learning models with available mobility surveys, which then serve to classify the trips observed by mobile network data; (iii) a hybrid approach that combines both methods. The project also served to enhance some Mobility Insights functionalities, such as the identification of trips associated with professional drivers (which are not potential demand of public transport services) based on non-home based trip patterns.
The solution provides hourly origin-destination matrices segmented by criteria associated with the traveller’s profile (home location, age and gender) and the trip characteristics (trip purpose, trip distance, trip mode, and passenger/professional trip). The case studies in Bogota and Buenos Aires covered several working days, Saturdays and Sundays from 2019, 2020 and 2021, so that the origin-destination matrices registered the changes in trip generation, trip distribution and modal share during the pandemic. The methodology includes a list of indicators to summarise the origin-destination matrices that were helpful to analyse specific aspects of the trends developed over the course of the pandemic (e.g., telework, e-commerce, etc.).
Outcomes
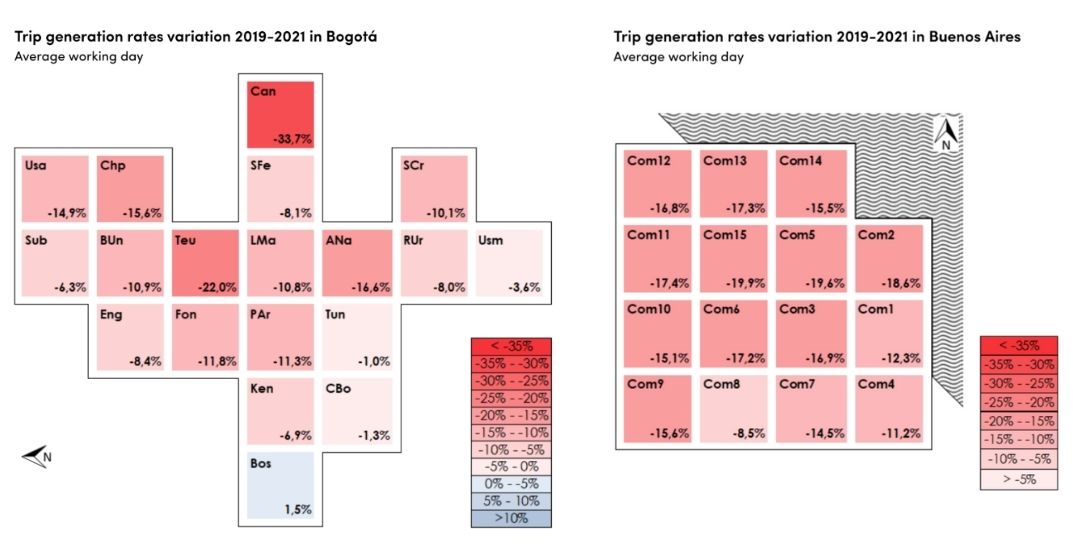
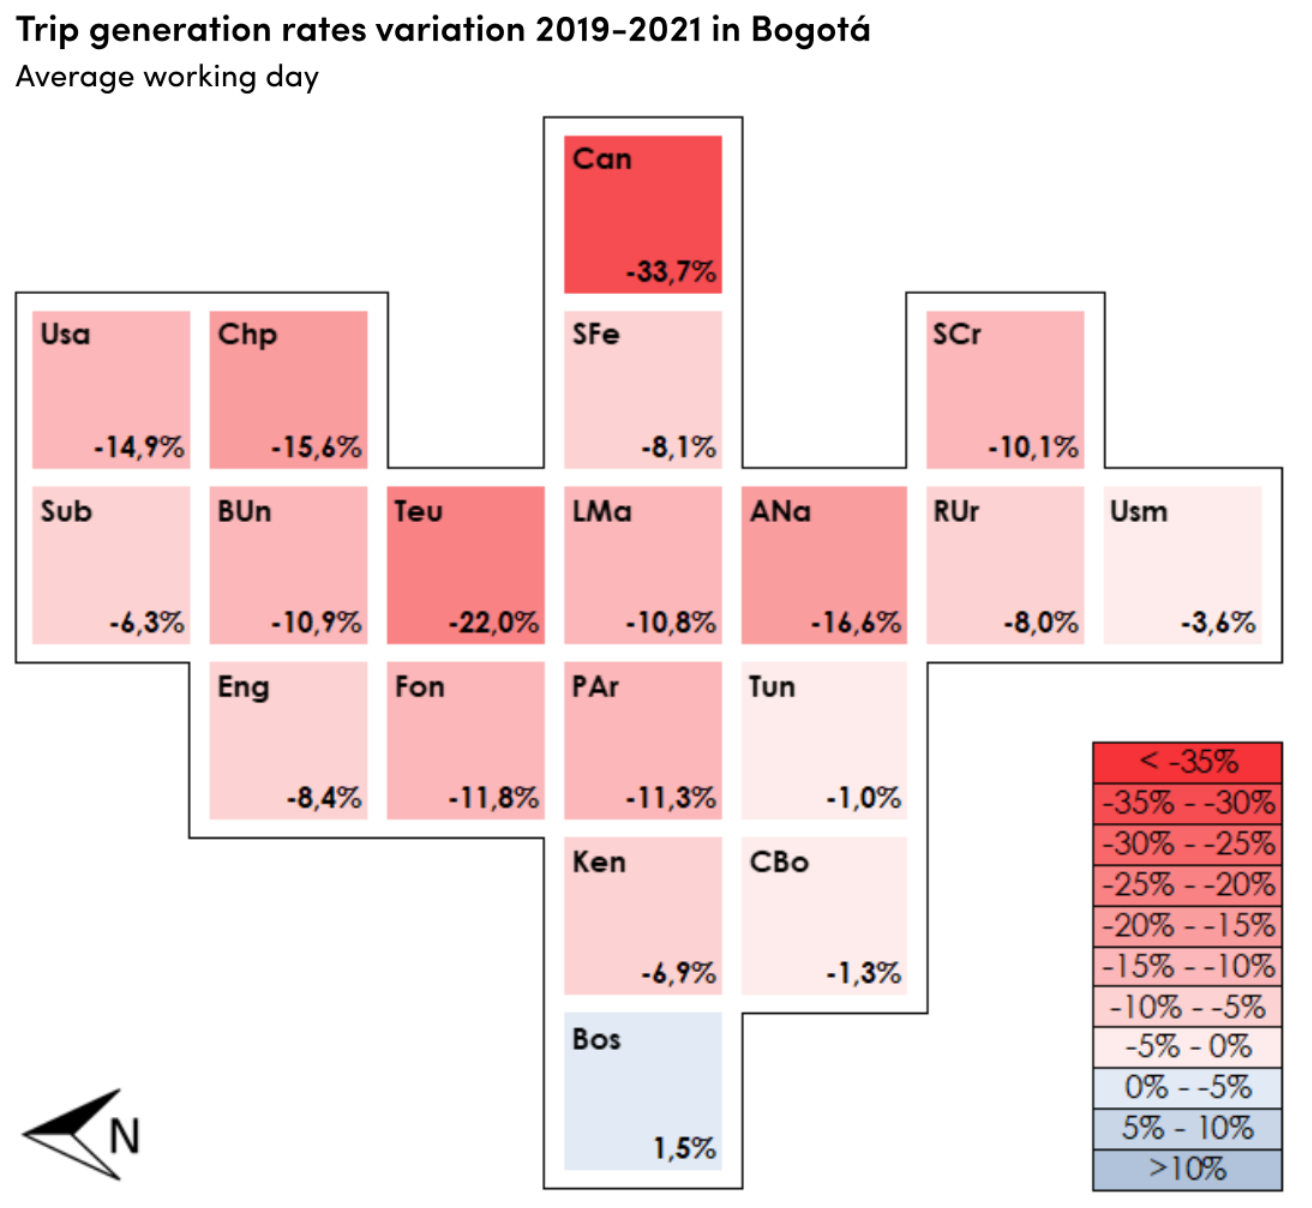
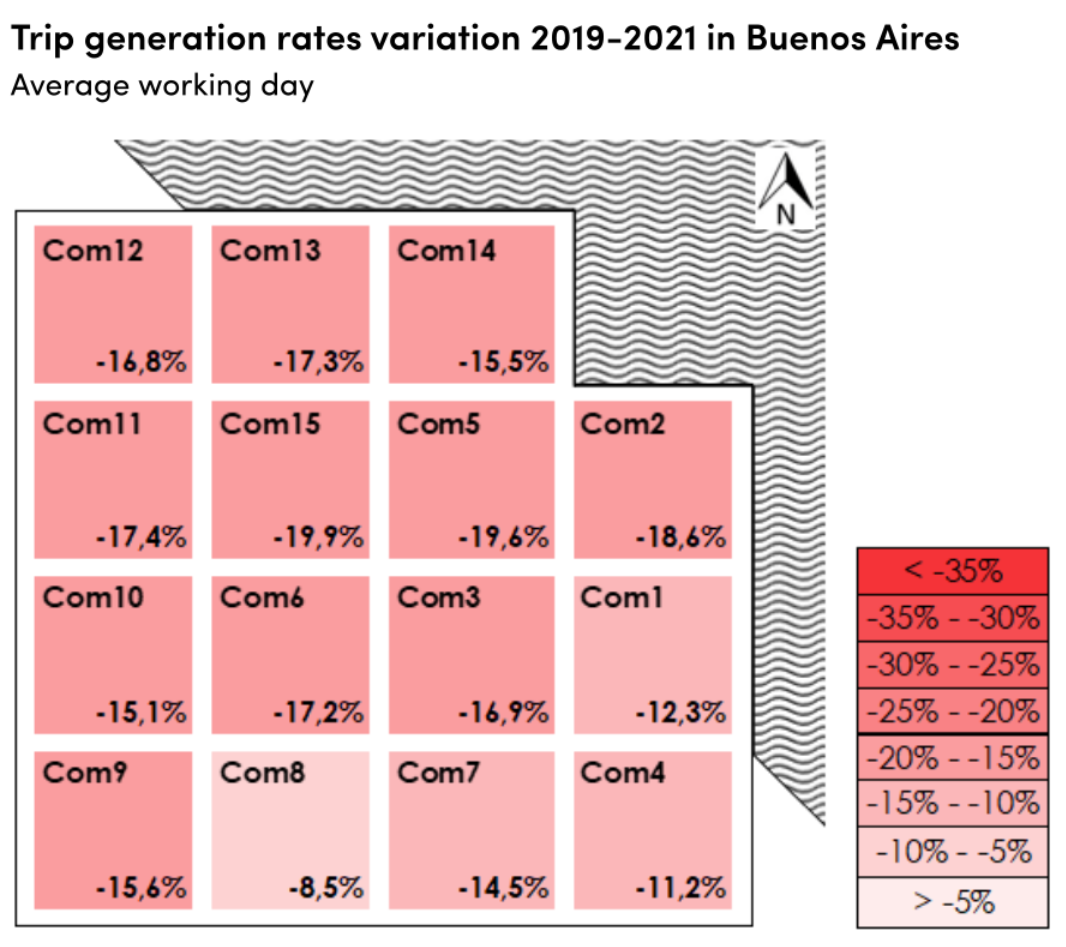
The results helped the local authorities of Bogota and Buenos Aires understand how their citizens modified their travel behaviour during the pandemic, and to what extent public transport requires adaptations to meet the new mobility needs of the population. The project revealed that COVID-19 had a long-lasting impact on trip generation rates, even after the end of all social distancing measures: 2021 trip rates were well below the levels registered in 2019 (-7.5% in Bogota and -17.5% in Buenos Aires). This fall in trip rates was higher among the population with higher socioeconomic levels. This bias was even more pronounced for home-work trips, which may reveal differences in the adoption of telework depending on socioeconomic status. The decline in overall mobility experienced in 2020 was more intense during peak hours, particularly in the morning (-23% in Bogota and -38% in Buenos Aires, compared to 15% and 25% at daily level, respectively).
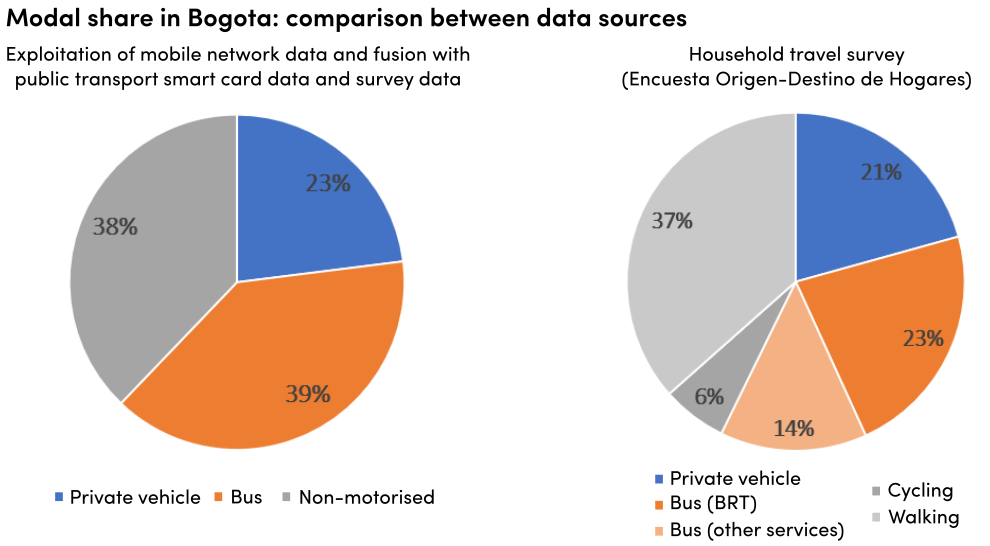
One of the most noticeable trends was the decrease in average trip distances, which fell from 5 km in 2019 to 4.2 km in 2020 in Bogota, and from 3.1 km in 2019 to 2.5 km in 2020 in Buenos Aires. As short trips accounted for a larger proportion of overall mobility, the modal share of non-motorised options (walking and cycling) increased drastically: from 39% in 2019 to 48% in 2020 in Bogota, and from 28% in 2019 to 41% in 2020 in Buenos Aires. Interestingly, the recovery of average trip distances during 2021 was more intense in Buenos Aires (almost reaching 2019 levels) than in Bogota, where it was still 12% lower than in 2019.
In 2021, public transport ridership was well below 2019 levels, showing a 20% drop in Bogotá and a 40% drop in Buenos Aires. This was the result of two factors: (i) the sharp decrease in the overall demand for medium and long-distance trips (larger than 5 km) within the metropolitan areas , where the modal share of public transport is usually higher; and (ii) the shift from public transport to private vehicles, particularly in Buenos Aires, where private vehicle modal share increased from 38% to 47% in 2020 and remained higher during 2021 (43%).
What we learnt
The ability of transport authorities and operators to ensure that public transport remains an appealing choice for citizens hinges on their capacity to monitor changing travel demand trends and adapt services to match the population’s mobility needs. The methodology developed by Nommon for the WB supports cities in this task, taking advantage of the growing availability of geolocation data from mobile devices. Instead of relying solely on a single data source, the proposed framework leverages the advantages of each data source through data fusion methods. The machine learning models that classify the trips observed from mobile network data by transport mode exploiting mobility survey information are a good example of these data fusion techniques. The framework accounts for the diversity of data availability contexts in cities, offering a range of options for calculating the required indicators and facilitating the replicability of the methodology.