Analysing public transport in the Community of Madrid through data from intelligent payment systems
Within the framework of the BD4PT project, Nommon drove the development of Transit Insights, a software platform employing data fusion techniques to provide accurate, reliable, and continuously updated information on public transport demand to transport authorities and operators. Nommon collaborated with the Madrid Regional Transport Authority, the most extensive, dense, and utilised public transport network in Spain, analysing indicators such as the hourly distribution of trips, line usage trends, and origin-destination matrices between different network zones.
Briefing
One of the most interesting data sources for characterising the use of public transport services are intelligent payment systems. From an operational standpoint, these systems offer several advantages over traditional billing and control methods: for instance, they facilitate and expedite vehicle access, and enable fare integration within a multimodal public transport system. From a planning and management perspective, intelligent payment systems generate data that, adequately processed and analysed, provide multiple indicators about transport demand.
On the other hand, data from intelligent payment systems has a number of limitations. The most significant one is that this data only provides information about legs within the public transport system, lacking details about the complete door-to-door modal chain. Additionally, the available information on the users’ sociodemographic profile is usually less rich than that obtained through travel surveys. These limitations can be overcome by enriching the information obtained from intelligent payment systems through the fusion with other data sources, such as mobile network data.
Within the Big Data For Public Transport (BD4PT) project, funded by the Spanish Ministry of Economic Affairs and Digital Transformation and the European Regional Development Fund (ERDF), Nommon developed Transit Insights, a software platform that employs data fusion techniques to provide accurate, reliable, and continuously updated information on public transport usage to public transport authorities and operators. In the context of BD4PT, we obtained data from the Madrid Regional Transport Authority (CRTM), which serves the entire Autonomous Community of Madrid (CAM) and even some cities beyond its borders. The significance of this case study is due to a triple factor:
- The public transport network of the CAM is by far the most extensive, dense, and used network in Spain. With over 13,000 stops, more than 600 lines, and over 1.5 million daily passengers making approximately 4.5 million trip validations every day. The challenge was to develop a system able to handle and exploit this information efficiently.
- When processing data from intelligent payment systems, the most common problem for identifying the origin and destination of a trip involves inferring the destination stop. In the CAM there is however a wide range of scenarios that Transit Insights must be able to deal with. For example, in suburban railway services it is necessary to validate the transport card both upon entering and exiting the station; in these cases, inferring the exit station is unnecessary. Additionally, there are some cases where the stop to be inferred is not the exit stop but the entry stop.
- While validation on urban buses typically occurs on board the vehicle and requires a new validation when changing to another line, in the metro, once the travellers have entered a station and validated their transport card, they can make transfers until reaching their destination station. Transit Insights considers this heterogeneity and applies the corresponding logic to each case.
Solution
Transit Insights integrates data from smart fare collection systems, vehicle location systems, and passenger counting technologies to assist in the planning and management of public transport services based on demand behaviour. The calculation process is automated, providing the user with continuous access to detailed information on what occurs within the public transport network.
The tool is composed of three main components: a data standardisation component, which cleans and prepares the data to be used; an inference engine, which transforms the input data into complete and detailed information about the use of the public transport network; and an indicator generation component, which, based on the results of the inference engine and their fusion with other data from complementary sources, generates understandable and exploitable information through an interactive dashboard providing various charts and tables.
Data standardiser
The first step of the data processing pipeline consists in cleaning, refining and standardising the input data used by the solution. Particularly relevant is the preprocessing of smart card validations, not only because they are Transit Insights’ main data source, but also because of the lack of a standard format. The standardisation module is designed to efficiently handle different implementations of smart card systems, translating each type of raw data into a unique, simple and understandable format.
Public transport supply data, on the other hand, are often available in a standardised form, such as the General Transit Feed Specification (GTFS) format. However, network information is not always available in this format; in these cases, a specific standardisation process is required.
In addition to smart card validation data and transport network information, the tool integrates other complementary data sources to refine, enhance, and expand the obtained results. This includes origin-destination (OD) matrices of total mobility flows obtained using Nommon’s Mobility Insights solution, as well as data on vehicle capacity and emissions for different vehicle types.
Inference engine
The inference engine is the core of Transit Insights, as it addresses the main technical challenge posed by the nature of smart payment systems: passengers usually validate their card to access the public transport service, but may not necessarily validate it again when exiting. This absence of destination information raises the need to infer the alighting stop associated with each boarding validation.
For inferring alighting stops, a technique called trip chaining is employed. This is possible because smart payment cards provide traceability of each traveller’s records over time, enabling the reconstruction of the complete sequence of validations. Trip chaining is based on the idea of assigning an alighting stop located nearby the boarding stop of the subsequent journey. This hypothesis is plausible given that most travellers are regular users of the public transport network and their trips follow specific patterns, such as home-work/work-home or home-work/work-leisure/leisure-home, where the destination of each trip performed by public transport approximately coincides with the origin of the next trip.
However, there are cases in which trip chaining is not applicable: for example, when the user has used an alternative mode of transport between two public transport trips or when only one validation is available. In these cases, probabilistic assignment is used for inferring the alighting stop, based on trips that have been determined through chaining. First, the observed patterns of the traveller under study are considered; if the sample size is insufficient, the patterns of all network users are considered, assuming that the traveller behaves similarly to other network users.
At this stage, travellers’ activities within the public transport network are known. To provide the complete picture of public transport mobility, the information for each trip must be refined with its exact origin and destination, thereby obtaining the complete door-to-door trip. To this end, the origin and destination points are probabilistically assigned within an influence area of the respective boarding and alighting stops. The factors that determine this assignment are the distance between the origin point and the stop, the location of other stops nearby, and, if available, the total mobility flows in these areas. The latter can be determined from mobile network data using our Mobility Insights solution.
Indicator generator
Finally, Transit Insights provides an interactive dashboard that enables users to easily analyse the results. The indicator generator transforms the output from the inference engine into information that can be represented through tables and charts.
Thanks to the fusion with other data sources, a complete picture of daily activity in the public transport network is obtained, enabling the analysis of a wide variety of indicators. Some of these indicators include:
- Demand indicators:
- Volumes of trips, legs, and travellers.
- OD trip matrices.
- Stop-to-stop matrices of trips and legs.
- Hourly profile of trips.
- Trip distance and trip duration distributions.
- Trip distribution per modes, operators, and routes.
- User profiles.
- Transfer indicators:
- Volume of transfers.
- Ranking of the stops most used to transfer.
- Modes and routes between which transfers occur.
- Indicators of connectivity between zones:
- Number of trips segmented by number of transfers.
- Minimum, modal, and average number of transfers.
- Existence of a direct connection.
- Average trip duration and relation to trip duration by private vehicle.
- Occupancy indicators:
- Occupancy per route or inter-station.
- Overcrowding and underutilisation warnings.
- Modal share indicators:
- Overall modal share and modal share per OD pair.
- Fraud and evasion indicators:
- Fraud indicators per zone or route.
- Emission indicators:
- Volume of pollutant and greenhouse gas emissions.
- Volume of emissions saved thanks to public transport.
Outcomes
To demonstrate the value proposition of Transit Insights, a study was conducted using validation data from the Madrid Regional Transport Authority for the week of February 14th to 21st, 2022. Some of the analyses conducted are described below. Figure 1 depicts the temporal distribution of subway trips on Monday, February 14th, 2022. The characteristic curve of a typical workday can be observed, with peaks in the morning, at midday, and in the evening. By setting the filters in the left panel, both the charts and the volumes indicated at the top are updated (total trips, daily average trips, and trip-kilometres).
Figure 2 shows the trend in the use of light rail and tram during the week of February 14th to 20th, 2022. We can observe a higher use of these modes during workdays as well as a decrease in the use of the Parla tram on Thursday, February 17th.
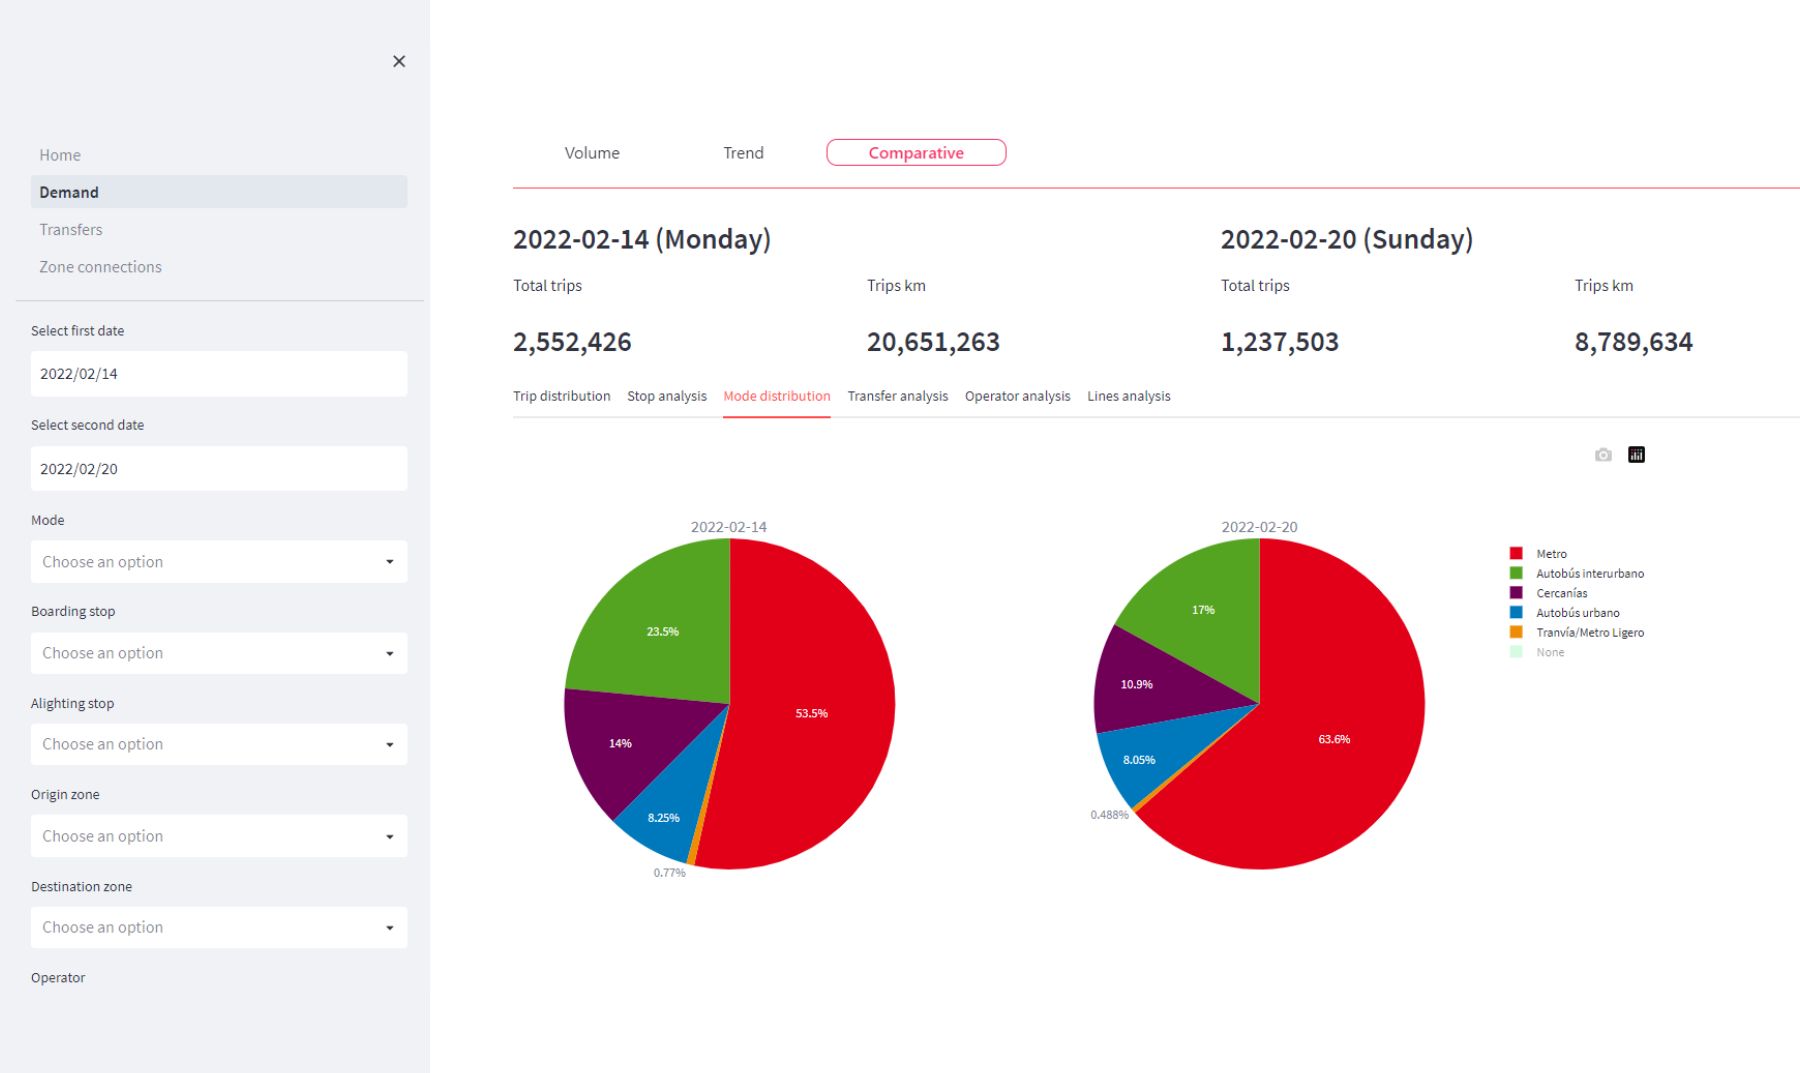
Figure 3 shows a comparative analysis of the most used modes on February 14th and February 20th, 2022 (Monday and Sunday, respectively). It can be observed that the demand for the subway increases on Sunday, at the expense of suburban railway and interurban buses, two modes of transport widely used for commuting.
Figure 4 analyses the most used card types, by type of card and area of validity. The standard monthly pass stands out, followed by the youth monthly pass, widely used among those under 26 years old due to its extensive coverage (the entire autonomous community) and affordability.
Figure 5 illustrates the most used stops for transfers from suburban railway to any other mode. The Atocha-Renfe station stands out as the most used, followed at a considerable distance by Chamartín, Nuevos Ministerios and Méndez Álvaro.
Figure 6 analyses the connection of the area of Moncloa-Aravaca-CIU (highlighted in yellow) with the rest of the CAM areas based on the average number of transfers made by users. Reddish tones indicate areas that users reach with few transfers, while, for areas with greenish tones, travellers use connections that require more transfers.
What we learnt
Public transport, as any other service, must understand its target customers to tailor its offer to their needs, ensuring that it becomes their preferred option to travel. Considering the speed at which mobility patterns change nowadays, traditional methods for the analysis of passenger behaviour, based on surveys, are insufficient for acquiring updated information.
Data from intelligent payment systems is the best alternative for the continuous monitoring of passenger demand: they provide detailed and continuously updated information on the use of public transport, enabling an in-depth understanding of passenger behaviour in a city or region, and entail lower acquisition costs than traditional surveys. In the BD4PT project, Transit Insights helped CRTM make the most of this data, enabling the analysis of public transport user behaviour, service usage monitoring, and the generation of mobility indicators for the efficient planning and management of the public transport system.
The continuous monitoring of public transport usage is an essential first step towards the goal of improving service quality to attract more users. This implies dynamically adjusting the service offer according to the expected evolution of the demand to provide the most efficient service, both in terms of passenger comfort and the resources involved. Nommon’s WiseTransit platform seamlessly complements Transit Insights’ functionalities, providing the passenger flow prediction and service optimisation capabilities required to achieve this objective.