Using Machine Learning to predict sociodemographic characteristics

Mobile phone data has become a fundamental tool to extract the mobility patterns of the population. However, this data often lack reliable information about some of the main sociodemographic characteristics of the users. In this article we will explain how we deal with these limitations at Nommon by using machine learning techniques.
Mobile phone data has become a fundamental tool to extract the mobility patterns of the population. However, some sociodemographic information about the mobile phone users is sometimes missing or that available is not always reliable. For instance, many customers do not provide information about their age or gender, while others have been assigned wrong values because the phone user is not the same as the contract holder. So, how can we overcome these limitations?
In this article we will explain how we deal with these issues at Nommon by using machine learning techniques. We will cover a novel approach to the estimation of customer’s age and gender using as predictive variables the mobility patterns suggested by the literature and observed in the mobile phone data records. This kind of information is of paramount importance for the development of meaningful and actionable information about people’s activity. The procedure followed can be divided into three main steps that we will detail throughout our article. These are:
- Identify the dissimilarities in the mobility patterns of people of different age and gender groups pointed out in the literature. The mobility variables with the most significant differences will be selected and enriched with new patterns obtained directly from the mobile phone data.
- Select a reliable sample of those mobile phone data users whose age and gender values are known to be correct. This will be the training sample when building our predictive models.
- Develop machine learning models able to estimate the age and gender of the mobile phone data users lacking correct values. In the case of the age model the users will be classified into four groups: 0-18, 19-44, 45-64 and >65. The input variables of the models will be the ones selected in the first step.
First step: let’s study what the literature has to offer
There are a number of mobility indicators that, according to the transportation literature, present important variations across different age and gender groups: average number of trips, trip purpose, trip distance, trip duration, temporal distribution of the trips and radius of gyration (this last one is defined as the average movement that a person covers with respect to its center of mass, i.e., it indicates the “size” of his/her trajectory throughout the day).
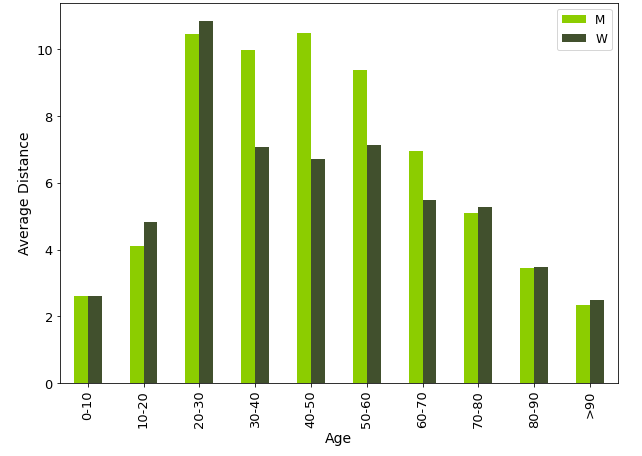
To decide which are the most relevant patterns for our analysis, we started with an exploration of the most recent household surveys available from Madrid (2018), Valencia (2019) and Seville (2017). For each mobility indicator mentioned in the literature, its distribution over the different age and gender groups in each survey was studied. The figure below shows the distribution of the average trip distance per day in Madrid’s survey. It can be seen that the indicator reaches a peak in the active population groups (mostly from 30 to 60), being these segments the ones with higher differences between men and women. The peak can be explained by the fact that people in the active groups have to commute everyday, while people outside those groups live a more sedentary life (elderly people) or go to school near their home (young people), while the difference between men and women in those groups may be explained by the fact that women make more short, home-based trips, while men are more likely to commute longer distances and make other leisure activities directly after work.
After conducting the survey analysis, the variables selected as more significant for the prediction of age and gender were the average number of trips, the average trip distance, and the radius of gyration. Once those variables were chosen, the inherent longitudinality of the mobile phone data was used to add new fields that could help capture other patterns:
- Two indicators were added: the average number of trips to or from work, and the home-work distance, to be able to distinguish more clearly the active population groups from the rest.
- The number of trips and average distance variables were segmented into short and long distance, in order to better capture the behaviour of working people that commute long distances by train or plane. Both variables were also divided into weekdays and weekends, so as to better characterise young and elderly people, who tend to move more frequently on weekends.
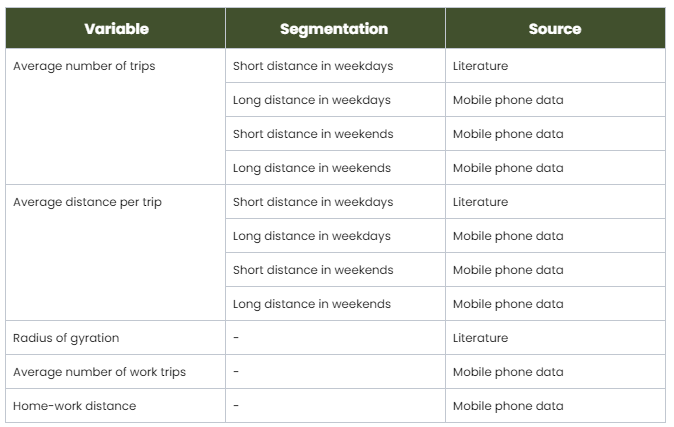
After joining the longitudinal variables with the ones from the survey, the eleven final variables selected for our machine learning model are the following:
Second step: selecting a training sample
So now we have the model variables, but how can we train a model that uses them? First, and more importantly, we need a sample of the mobile phone data to be used in the training process. In machine learning, selecting a training sample that is representative enough such that the model developed is able to accurately generalise is key for the development of a high-performance model. Therefore, we must be able to obtain a sample of users that covers all the possible age and gender groups, and most of all, we need their age and gender to be reliable.
As mentioned earlier, a portion of the mobile phone users have incorrect values of age and gender attached to them (e.g., if the user is not the same as the contract holder), or have no values at all. Therefore, to form our reliable sample, only users that were the sole members of their contract and had age and gender information were selected. However, this sample has two main drawbacks. First, there are no users younger than 18 (all the users that are single members of their contract are older than 18). Second, for adults, the reliable sample is imbalanced in terms of age, as 50 % of the users are in the 19-44 segment, 35 % are between 45 and 64 and only 15 % are over 65.
To overcome these issues the following approaches were followed:
- To deal with the lack of sample under 18, a nested approach was followed. First, a ML model was trained using the mobility patterns from Madrid’s household survey to classify users in two groups: under-age and adults. Next, a machine learning model was trained using the reliable sample from mobile phone data to further classify adults into smaller age groups (19-44, 45-64 and >65).
- To deal with the sample age imbalance in the adults sample, an oversampling technique called SMOTE [1] was used, which basically oversamples the smaller groups by creating new synthetic samples that are not exactly duplicated from the existing ones, but a combination from them.
Third step: developing our machine learning models
Once the reliable sample is computed, the mobility indicators selected in the first step are calculated. Now we are ready to train the models. The approach developed to build the predictive models was the following:
- Build the age model:
- Build a ML model trained only on survey data able to predict whether a user is above or below 18 years old.
- Build a ML model on the reliable sample users able to estimate whether their age is in the group 19-44, 45-64 or >65.
- Build the gender model: train a ML model able to estimate gender.
The age model
Let’s start with the age model based on the survey data. To be able to train a model with survey data and then evaluate it on users from the mobile phone data, the input variables of the model must be computable from both datasets. Because of that, the number of variables we can calculate is lower than the ones mentioned in the previous section, as longitudinal information, like long-distance trips and data over the weekends, cannot be extracted from the survey. The final variables used to calibrate the model were the average number of short-distance trips in weekdays, the average distance, the radius of gyration, the number of work trips, and the home-work distance.
The training process for this model was the following:
- First, the dataset is divided (stratified) into a training and a test set. The training set was standardised by the home district of the users so as to keep all the variables in the same range, as mobility indicators are different depending on the region you live in. This standardisation process was then applied directly to the test set.
- Then, a model selection process is applied. During this process four machine learning techniques were run for different combinations of parameters on the training set to calibrate a model that classifies every survey participant as adult or under age. The tested techniques were Decision Trees (DT), Random Forest (RF), Support Vector Machines and Neural Networks (Multilayer Perceptron). To obtain the best model for each one of these techniques, the k-fold cross-validation (CV) resampling technique [2] was used.
- The average validation error was calculated using the F1-score, which computes the harmonic average between precision and recall. The definition of each of these metrics is the following:
- Precision: number of users correctly classified as being from one class with respect to the total number of users classified as being from that class.
- Recall: number of users correctly classified as being from one class out of the total number of users that are labelled with that class.
- F1-score: harmonic average of precision of recall. As there might be models with, for instance, high recall and low precision, it is interesting to give a unique number that takes into account both metrics. Using the harmonic mean avoids hindering underperformance from one of the two metrics (e.g., it prevents the model to score 0.5 when the precision is 1 and recall 0).
- After computing the average validation error for every technique and every combination of parameters, the best model was selected.
The cross-validation and test results for the best model identified, the Decision Tree, are shown in the table below:
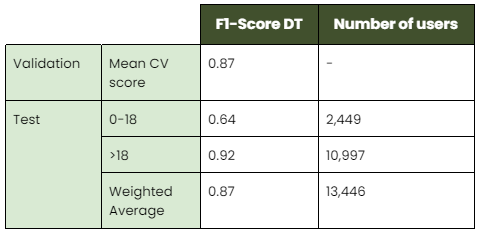
It seems that the model can estimate almost perfectly the adult users! Regarding under-age people, the score is almost two thirds, which is also adequate for our purposes.
Once the survey model is trained, now it’s time for the age model based on mobile phone data. This model will classify adults into one of the following groups: 19-44, 45-64 or >65. The training procedure is similar to that of the survey-based age model with the only difference that this one is trained using the oversample data thanks to the SMOTE algorithm introduced earlier in the article.
The techniques tested in this case were Random Forest, Gradient Boosting, Multilayer Perceptron, and k-Nearest Neighbors. The model with the best cross-validation results was Random Forest. The final results for this model are shown in the table below:
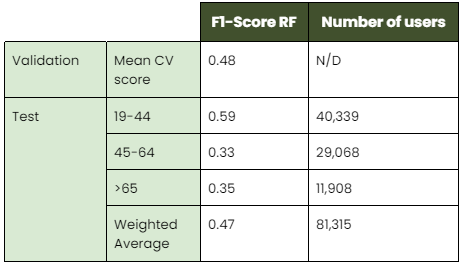
The performance is lower than the one obtained in the survey model, as some groups are more difficult to predict (45-64, >65). The best validation score obtained is 0.48 (15 points higher than the baseline model, which would return 0.33). This seems to indicate that using only the mobility indicators selected one cannot perfectly segment users in terms of their age.
The gender model
Regarding gender, the same approach was followed, but without having to solve the imbalance problem, as there were almost the same number of men and women.
The F1-Score obtained in this case was 0.55, which implies that gender is harder to estimate using mobility patterns, as men and women are not that different in this aspect. However, in these cases, one shouldn’t stop looking for improvements! There might be other variables that are more predictive of the gender of mobile phone data users. Some examples might be navigation data from online searches, and SMS and calls information per day.
Conclusion
In this article we have seen how we are able to assign sociodemographic attributes with a high degree of reliability to a set of mobile phone data users that don’t have that information. Furthermore, we have explained how this lack of information coming from mobile phone data can be handled by developing predictive models through machine learning techniques, outlining the exploratory and preprocessing analyses that are required before being able to calibrate the models.
The development of these models, which take advantage of the vast potential of mobile phone data when capturing the mobility patterns of the population, will let us perform mobility studies across multiple levels. For example, we can examine other mobility differences between women of different ages in any Spanish region or town.
Finally, we have seen that there is still room for improvement, especially in predicting the gender of the users, so a further analysis of the extensive information the mobile phone data provides will be performed to obtain other patterns that can better discriminate women from men, as well as people from different age groups.
Bibliography
[1] Chawla N. et al (2002), “SMOTE: Synthetic Minority Over-sampling Technique“, Journal of Artificial Intelligence Research, 16 (1), 321-357, https://doi.org/10.1613/jair.953
[2] Berrar D. (2018), “Cross-Validation”, Reference Module in Life Sciences, https://doi.org/10.1016/B978-0-12-809633-8.20349-X.