The least used station of Rodalies in Barcelona: Borgonyà

A look over the least used stations in Spanish commuter railways [Part 2]
Transport planners often struggle to solve bottlenecks in saturated networks. However, sometimes the challenge is to understand why certain transport services remain underutilised. Our curiosity about travel behaviour led us to combine mobile network data, ticketing data and survey data to explore what is behind the limited passenger flow of the least used stations in the Spanish commuter railway network. On this occassion, we look at the least used station of Barcelona’s commuter railway system: Borgonyà.
Earlier this year we started a series of posts looking at the least used stations of the Spanish Renfe commuter railway systems (known as Cercanías Renfe). The aim of this initiative — inspired by the series of Youtube videos from Geoff Marshall — is to illustrate how the combination of different mobility data sources can improve our understanding of how transport systems work, taking advantage of the increasing availability of travel demand information. Our first stop was at San Yago, the least used station of Madrid Cercanías network. Now that the world-leading Tomorrow Mobility and Smart City Expo congresses are being celebrated in Barcelona, it is a good time to look at the least used station of Barcelona’s commuter railway system, which is the second most used system in Spain.
The Catalan Government integrated in 2010 all the regional and metropolitan trains under the brand Rodalies de Catalunya. The service uses Adif railway network (Spanish railway infrastructure manager) and is operated by Renfe (the Spanish state-owned rail operator). Rodalies network spans all the region, but most services run in Barcelona province, which is home of the 75% of Catalan population. As with the rest of commuter railway services, Renfe provides data on average daily passenger counts by Renfe in its Open Data portal. This allows us to identify which is the least used station in Barcelona province. In this article, we will use our Nommon Mobility Insights API to understand the context of the station and identify if there is margin for capturing more demand.
The least used station of Rodalies in Barcelona: Borgonyà
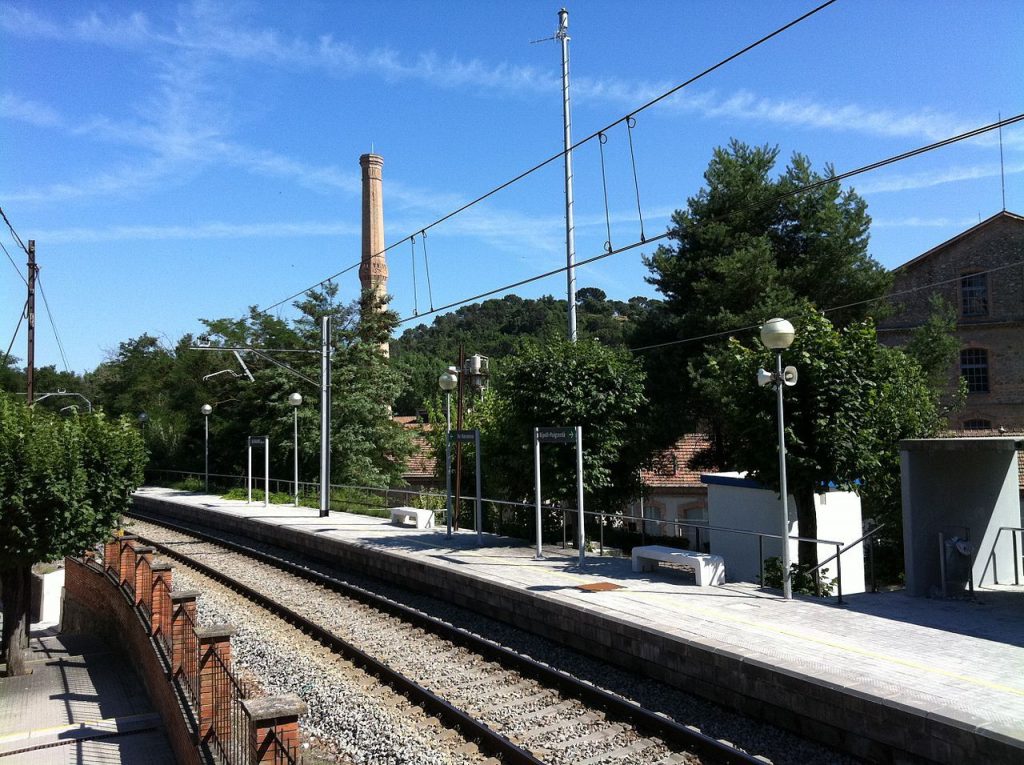
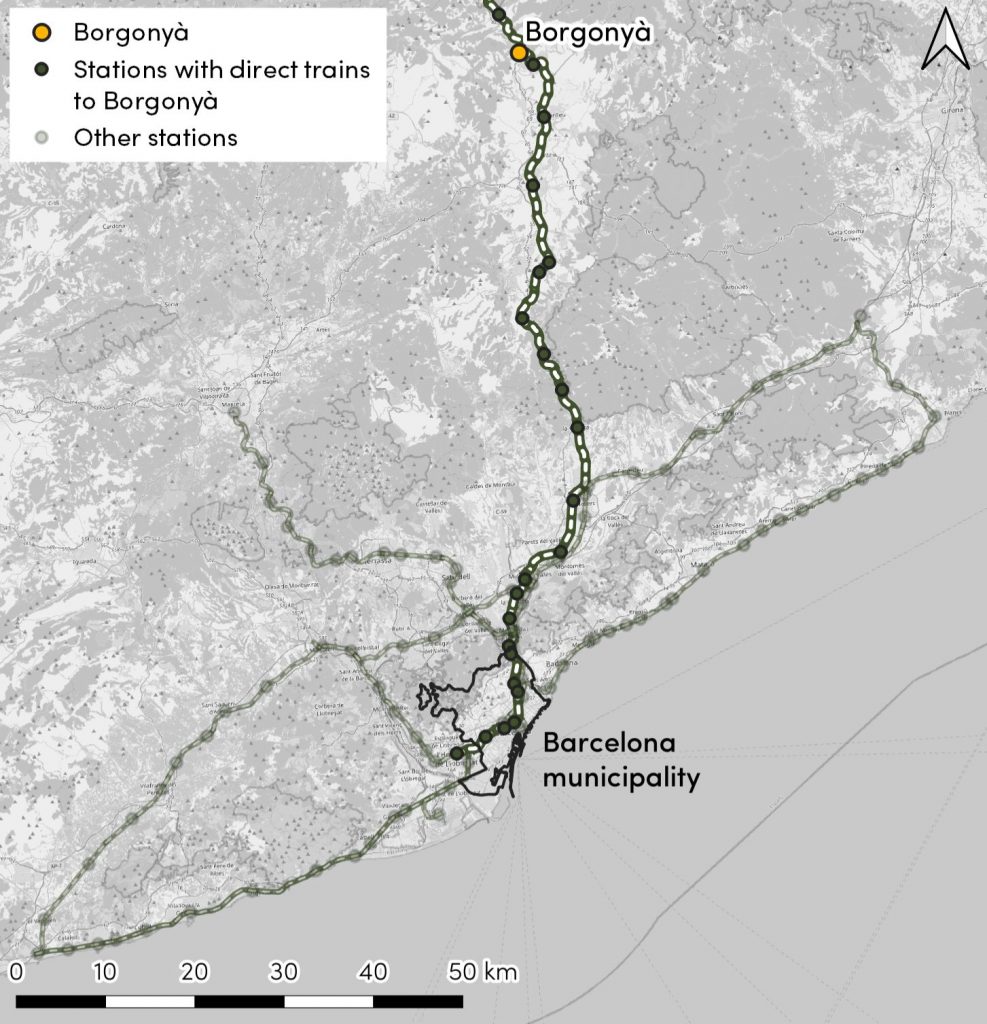
The least used stop of Rodalies de Catalunya in Barcelona province is Borgonyà. The stop is a halt in Adif line no. 222 that goes from Barcelona to Puigcerdá, a town on the border with France. The stretch from Ripoll to Barcelona, where the stop is located, was built in 1879, in order to transport coal from the mines in northern Catalonia to Barcelona ports. The station provides service to the town of Borgonyà (371 inhab., 2021), which belongs to the municipality of Sant Vicenç de Torelló (2,077 inhab., 2021). Borgonyà is one of the ‘textile colonies’ that were established across Catalonia during the second half of the 19th century, following the growth of the textile industry in the region. In 1890 a Scottish company, J&P Coats, established a sewing thread factory in the area, giving rise to the town. The company, later merged with the Catalan company Fabra i Portabella, ran the factory until 1999, when it was closed. Figure 2 shows the location of the stop in the commuter railway network of Barcelona province.
Borgonyà is served by line R3, running from L’Hospitalet de Llobregat to Puigcerdà and passing through Barcelona inner city. This line has up to 38 daily services per direction on working days, but only 16 services go beyond Vic to Ripoll and Puigcerdà. Nine out of these 16 services stop at Borgonyà, yielding an average frequency of 90-120 minutes. The station was used in 2018 by an average of only 23 passengers per day, summing up boarding and alighting passengers. This is nearly 4,200 times less than Sants, which is the most used station in the network of Rodalies de Catalunya.
Using Mobility Insights API to understand the context of Borgonyà
Nommon’s Mobility Insights API service allows us to leverage mobile network data to understand how low 23 passengers per day are for a train stop such as Borgonyà, by analysing total mobility flows to/from this town. The mobile network data that Nommon exploits in Spain provide large sample sizes (around 20% of the population), which are ideal for a fine-grained analysis of trip generation and distribution patterns. The flexibility of the API enables us to design a specific OD matrix study for analysing the potential demand of commuter railway services in Borgonyà.
First, we should decide on a study period. We chose three consecutive weeks in March 2019. As a pre-pandemic period, this seems more comparable to the 2018 data that Renfe provides through its Open Data portal. A key benefit of mobile network data is the availability of historical information on travel demand patterns: as of today, the Mobility Insights API covers 11 months from 2019, 2 months from 2020, 9 months from 2021 and 7 months from 2022.
Second, the API offers several options for the temporal resolution of the OD matrices: daily, hourly, ad-hoc time intervals… We chose hourly resolution for this study, in order to analyse the trip time distribution to/from Borgonyà.
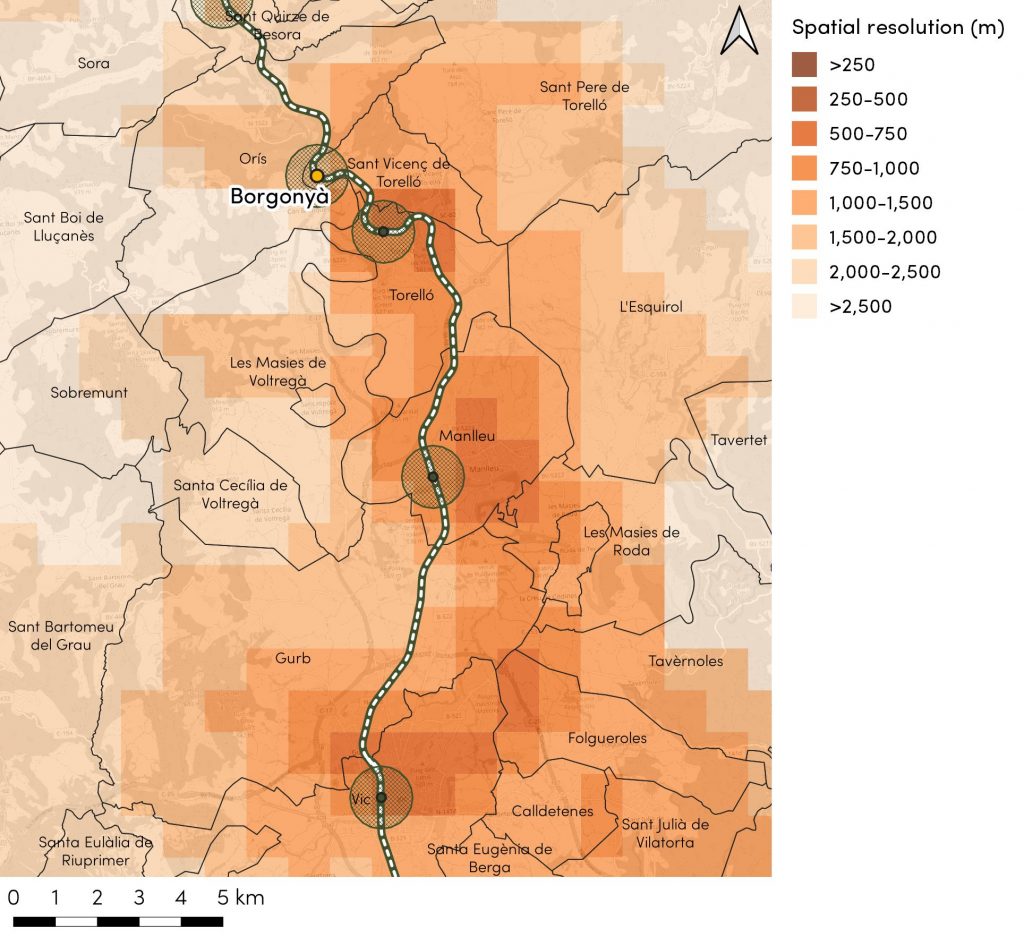
Third, a zoning system must be specified to aggregate the mobility flows. Mobile network records are registered at the level of the coverage areas of the antennas, but Mobility Insights supports any zoning system, thanks to its aggregation algorithms that employ land use data to assign trip origins and destinations from coverage areas to zones. We decided to employ zones that represent the walking catchment areas of the Rodalies de Catalunya network, which have been approximated with a 750 metres spatial buffer around the stations (~10 minutes). In addition, we divided the remaining Catalan territory by counties (‘comarcas’) and the Osona county by municipalities. The size of the zones should be aligned with the spatial resolution of the mobile network data in each area, which depends on the number of antennas. This typically ranges from hundreds of metres in urban areas to some kilometres in rural areas. In the case of Borgonyà, the spatial resolution is 1.5-2 km (see Figure 3), so it is advisable to have the whole municipality of Sant Vicenç de Torelló as a zone instead of using the 750 metres buffer, which can remain applicable to other stations located in more densely populated areas. In order to obtain an estimate of the trips to/from the catchment area of Borgonyà station, we will post-process the OD matrix assuming that the number of trips to/from Borgonyà town out of the total number of trips to/from the municipality is proportional to the population weight of Borgonyà town within the municipality (18%).
Beyond the zoning system, the API enables us to specify the target OD pairs for the analysis. It is possible to choose between a squared OD matrix (all possible OD pairs) and a filtered OD matrix that includes only certain target OD pairs. We are only interested in flows to/from Sant Vicenç de Torelló, the municipality where the Borgonyà station is located.
Finally, the API offers several segmentations of the overall travel demand, depending either on traveller profile dimensions (age, gender, income, home location) or on trip characteristics (professional/personal trip, trip purpose, trip distance). As we are interested in the potential demand for railway services, we included the professional/personal trip segmentation (to filter out professional trips, e.g., those made by van or truck drivers during their activity, for which the train is not a viable alternative). We also included the home location segmentation, to have an overview of the home location of travellers to/from Borgonyà.
As you can see below, the API user interface allows us to easily specify the study, once our zoning system and list of target OD pairs are ready.
Borgonyà potential demand figures
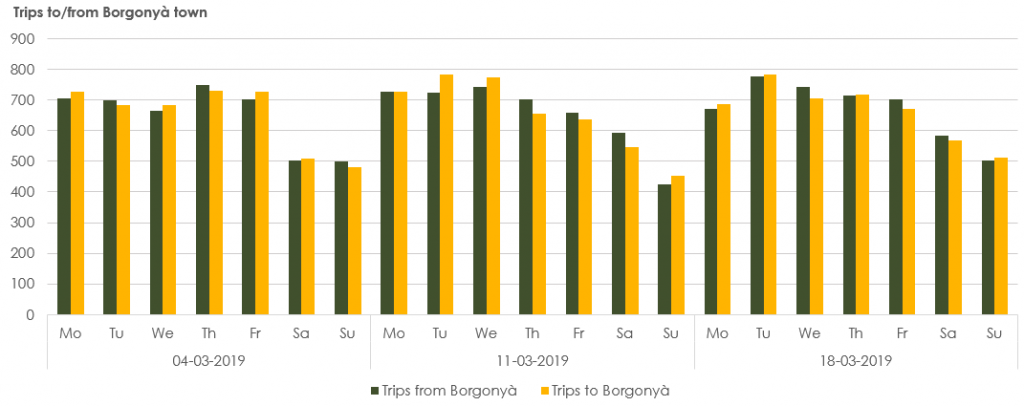
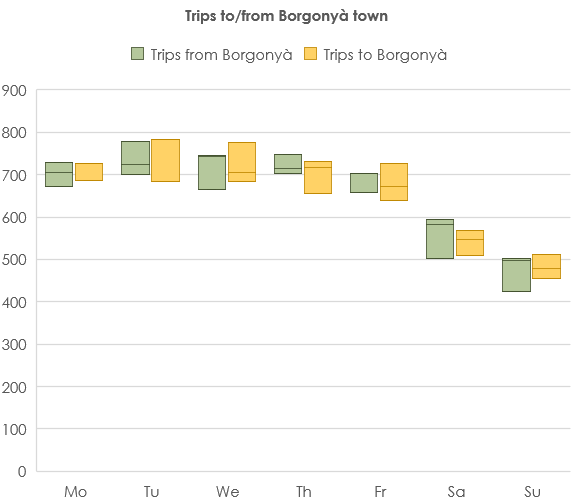
The OD matrices extracted from the Mobility Insights API reveal that, on average, 1,300 daily trips are made with origin or destination in Borgonyà town. The flows are slightly higher on weekdays than on weekends. Sunday is the day with the least number of trips (less than 1,000 daily trips on average). On the contrary, more than 1,400 daily trips are observed from Mondays to Thursdays. Figure 5 shows the daily number of trips along the three weeks analysed, and Figure 6 shows a box plot summarising the trip volume statistics at weekday level. The home location segmentation reveals that nearly half of the trips (45.7%) are made by local residents, and most of the remaining trips are made by residents from bordering municipalities such as Torelló (23.7%) and from the most populated municipalities of the Osona county (Manlleu, 8.8%; Vic, 3.6%).
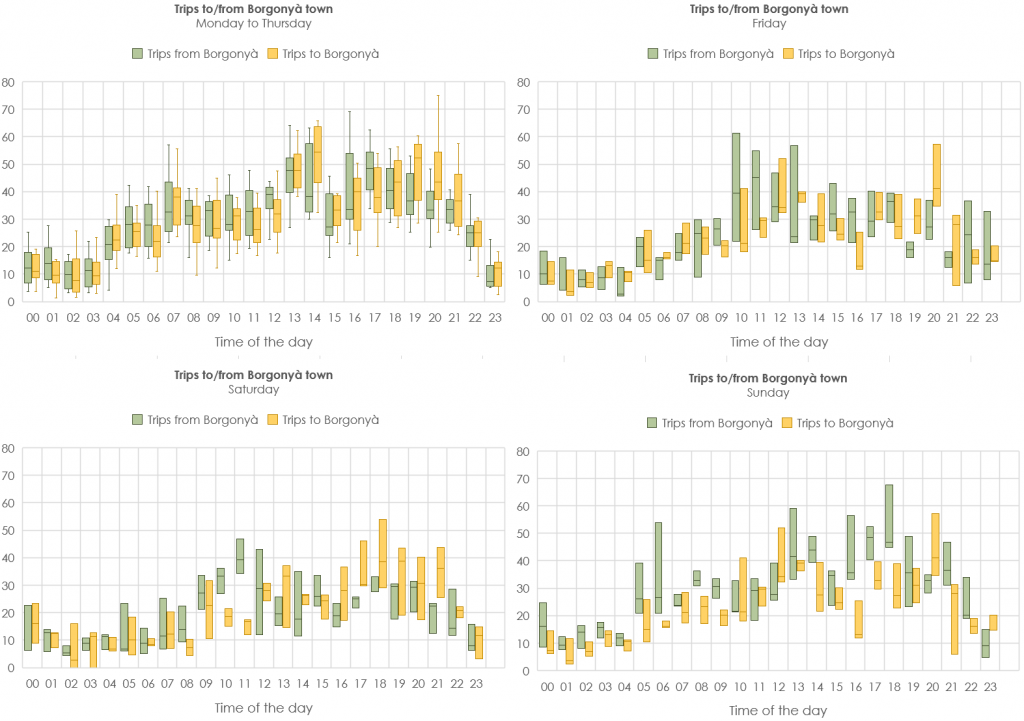
Trip time distribution provides two relevant insights, beyond the expected differences between weekdays and weekends with regard to morning peaks (Figure 7). First, origin and destination flows are quite balanced in weekday peak hours. This means that the area does not only generate morning trips from their residents, but also attracts morning trips from workers in the companies established in Borgonyà’s small industrial park. Second, the significant inflows on Friday evening and outflows on Sunday evening suggest that there are second homes used during weekends in Borgonyà.
The information from the OD matrices (1,300 daily average number of trips starting or ending in Borgonyà) allows us to estimate that the passenger flow in Borgonyà station accounts only for 1.8% of the overall mobility demand in the town. This information is very valuable: it should be noted that it is very difficult to obtain this information through other data sources than mobile network data. First, because intercept surveys conducted at the station would only cover current users of the rail services. Second, because the household mobility surveys that have been conducted in the area usually include much smaller samples (e.g., the annual survey conducted in the Barcelona metropolitan region includes 400 interviews in the whole Osona county, which implies a sample size of 0.25% of the population).
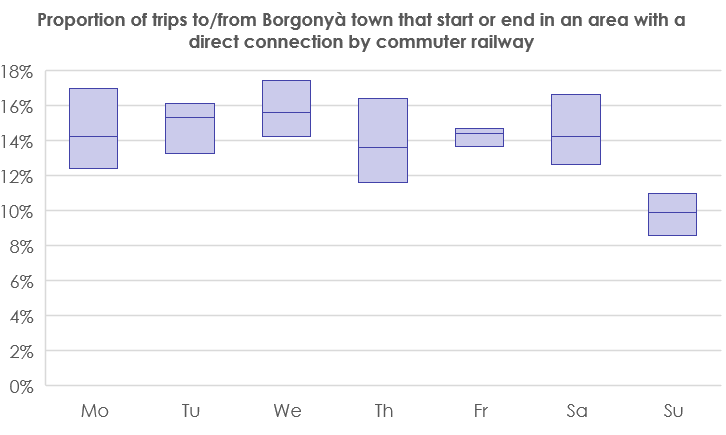
The OD matrices also reveal the trip spatial distribution patterns in the area. By including zones that are associated with the walking catchment area of the stations of Rodalies de Catalunya network, it is possible to know how many of these 1,300 daily average trips have an origin or destination close to another station that is directly connected with Borgonyà. These trips can be considered as an estimate of the potential demand of Borgonyà station. On average, 14.8% of the trips to/from Borgonyà started or ended in areas with a direct commuter railway connection. If it is assumed that all Borgonyà passengers would start or end their trips in these areas, the approximated modal share of the rail services among their potential demand is 11.8%, 6.5 times higher than the proportion referred to the total number of trips to/from the area. The closest station, Torelló, accounts for 76% of the potential demand trips. The second station with the largest proportion of potential demand trips is Vic (12%). Barcelona municipality stations only account for 0.2% of the potential demand trips.
How competitive is the commuter railway service to Borgonyà?
In order to understand why the commuter railway service manages to capture less than 10% of its potential demand to/from Borgonyà, it is useful to analyse the differences between the travel times and frequencies offered by this service and the remaining transport options. Some conclusions can be drawn from this supply-side analysis:
- Rodalies is the fastest way to get to Borgonyà by public transport. Borgonyà is also served by bus, but there are only direct services to the rest of Sant Vicenç de Torelló municipality and to Torelló. Other destinations such as Manlleu, Vic or Barcelona require transfers.
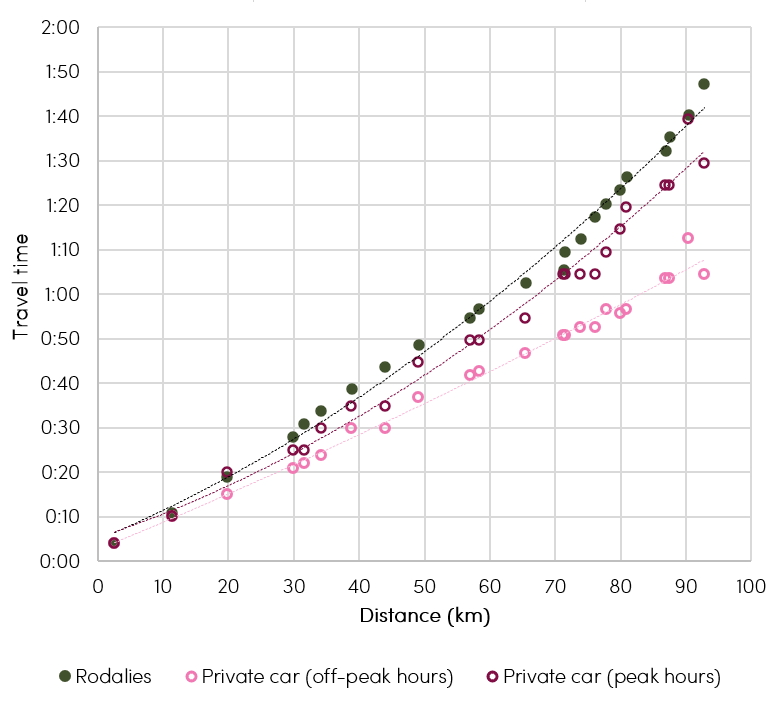
However, there are little chances to compete with the flexibility and travel times offered by private vehicles. A significant barrier to the competitiveness of the rail service is its low frequency (a train every hour and a half or two hours). This means that passengers should adapt their desired arrival or departure times to the rail schedules. This comes in addition to the fact that most destinations can be reached by car in less time than by rail, as Figure 9 shows. The difference between rail and car travel times is far lower during peak hours, where congestion can be significant in the Barcelona metropolitan area. Actually, car travel times to Barcelona municipality are 30% shorter than rail travel times in off-peak hours, and only 10% shorter in peak hours.
The availability of fine-grained travel demand information through mobile network data allows us to add the passenger needs factor to the competitiveness analysis:
- Most of the potential demand is to/from Torelló (72%), a bordering municipality very close to Borgonyà. The town is linked to Torelló with a bus line that has up to 23 services per day (it is operated on demand, if any passenger requests the service). The bus service provides greater flexibility than rail services both in terms of schedules (more frequencies) and destinations, as it has several stops in Torelló.
- Less than 20% of the trips to/from Barcelona municipality have origin or destination within a walking distance from a railway station with direct connection to Borgonyà. The daily average number of trips between Barcelona and Borgonyà is very low (probably less than 10-15 trips). Hence, a growth in the captured demand in this OD pair would have a very limited effect on the total figures of Borgonyà station. In any case, this potential growth may be hindered by the fact that most trip origins and destinations take place in locations that are out of the walking catchment areas of the Barcelona stations with direct connections to Borgonyà. As we highlighted when analysing Madrid Cercanías’ least used station, multimodal connectivity is key to broaden the catchment areas of commuter railway stations in urban areas.
- There is margin for capturing more demand to/from Vic. Vic accounts for 12% of the potential demand: it is estimated that around 20-30 daily trips take place between Borgonyà and the walking catchment area of Vic station. Railway travel times and car travel times are similar (15-20 minutes), and the bus connection requires a transfer in Torelló so it takes more time (up to 45 minutes). If rail service frequency were higher it is likely that more demand would be captured. Additional services between Ripoll and Vic with smaller trains could be a solution, although this depends on the available infrastructure capacity (single track) and on further demand studies supporting the idea.
Conclusion
Mobile network data processed with the Nommon Mobility Insights API service enabled an analysis of the potential demand of the least used station in the Barcelona commuter railway system: Borgonyà. On average, only 23 passengers per day use Borgonyà, according to Renfe Open Data. This accounts for less than 2% of the trips with origin or destination in this town. If only trips to/from the areas next to stations that are directly connected to Borgonyà are considered, the rail services are used by 11.8% of their potential demand. The main supply side factors that prevent Borgonyà station from capturing more trips are probably the very limited service frequency, which requires passengers to adapt their desired arrival and departure times to the rail schedules, and the higher travel times compared with private vehicles. The demand analysis enabled by mobile network data offers additional insights: most of the potential demand is composed of trips to/from the neighbouring municipality of Torelló, for which bus services seems a better public transport option; most of the potential demand to/from the city of Barcelona is not fully covered by the catchment areas of the commuter railway stations within the city. Interestingly, there seems to be potential to capture more trips to/from Vic if further travel demand analyses support the idea of additional frequencies in the line.