The least used station of Cercanías Madrid: San Yago
A look over the least used stations in Spanish commuter railways [Part 1]
Inspired by the brilliant videos from Geoff Marshall, we kick off a series of posts to look at the least used stations of the Spanish Renfe commuter railway systems, Cercanías Renfe. In this first article, we analyse the least used Madrid Renfe Cercanías stop: San Yago.
The COVID-19 pandemic has brought unprecedented scenes of empty transport terminals. While most bullicious airports and stations became silent from one day to another, as travel demand levels crashed down, some public transport hubs did not notice the pandemic at all, as they were already usually quiet and solitary. Some of them supported large demand flows in the past, but have experienced how travellers shifted to other modes or destinations. Others play a key role in making rural places accessible, enabling their development. Interestingly, it is not uncommon to find cases where the potential role of the terminal remains dormant, waiting for improvements in their integration in the transport system to become more attractive for users.
Inspired by the brilliant series of videos from Geoff Marshall, this series of posts looks at the least used stations of the Spanish Renfe commuter railway systems (known as Cercanías Renfe). Cercanías was created in the 1980’s as a common brand for all the commuter services run by the state operator Renfe. Cercanías has today up to 12 networks across the country with more than 500 stations. With 437 million passengers per year, it accounts for 76.8% of the heavy rail passengers in Spain [1].
Why look at these underused stations? We want the series of posts not only to be a curious amusement for transport enthusiasts like us, or to bring to the spotlight interesting locations around Spanish cities -even though most of the stations we’ll see are great places to start a hike 🌲. We want to illustrate how the combination of different mobility data sources can improve our understanding of how transport systems work, taking advantage of the increasing availability of travel demand information. First, these posts are possible thanks to the publication of the average daily passenger counts by Renfe in its Open Data portal, covering all Cercanías systems. This step forward made by Renfe is very promising, and we hope that this drive for transparency is followed by other transport operators and authorities. Second, we look at the overall travel demand patterns in the catchment area of each station exploiting mobile network data, one of the sources we use at Nommon for providing insights on population dynamics. Third, wherever survey data is available, we will analyse the additional dimensions of travel behaviour that can be extracted from this source. In short, we will try to shed some light on what drives these stations to get such limited usage rates thanks to a data fusion exercise.In this first article, we look at the least used station of the most used system, which is Madrid Cercanías network.
The least used station of Cercanías Madrid: San Yago
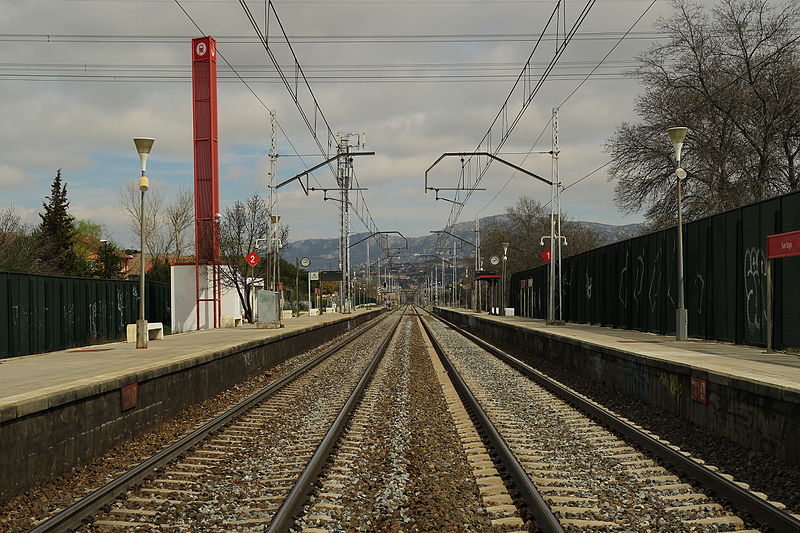
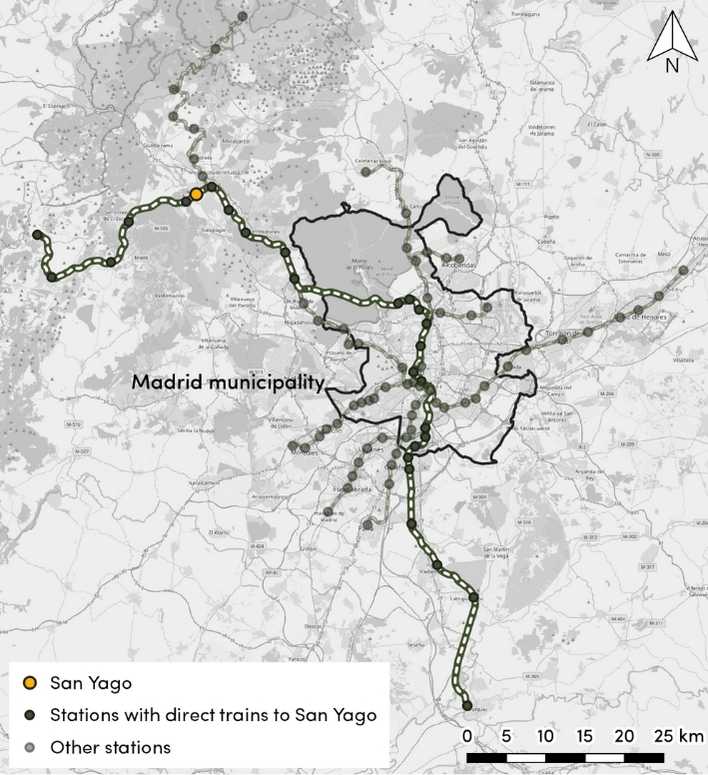
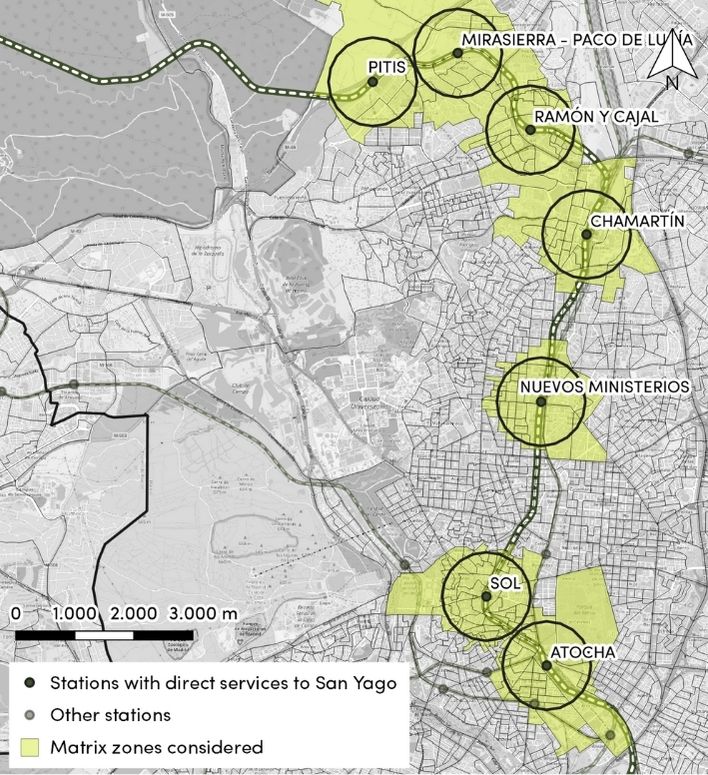
The least used Madrid Renfe Cercanías stop is San Yago. The stop is a halt in the Adif line no. 100 that goes from Madrid Chamartín to Irún. The stretch from Madrid to El Escorial, where the stop is located, was built in 1861. The halt was not part of the original project, as it was built during the 1960’s to provide service to “Colonia España”, a low density residential area developed in the late 1950’s that belongs to Galapagar municipality (34,497 inhab., 2020). However, it is actually much closer to Collado Villalba centre town (64,378 inhab., 2020). Figure 2 shows the location of the stop. San Yago is served by line C-3a, running from Aranjuez to El Escorial passing through Madrid inner city. The number of services stopping at the station varies according to the day of the week: from 25 per direction on working days to 18 per direction on Sundays. The train frequency varies from 15 minutes in peak hours to 60 minutes in off-peak periods. The station was used in 2018 by an average of 352 passengers per day, summing up boarding and alighting passengers. This is nearly 1,000 times less than the most used station in the network (Atocha)!
Putting San Yago figures into the context of overall travel demand
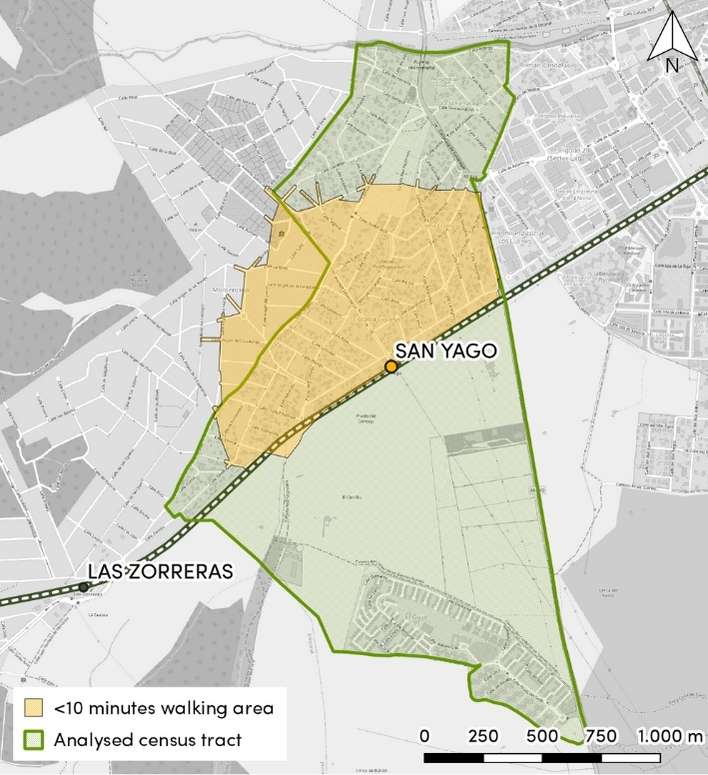
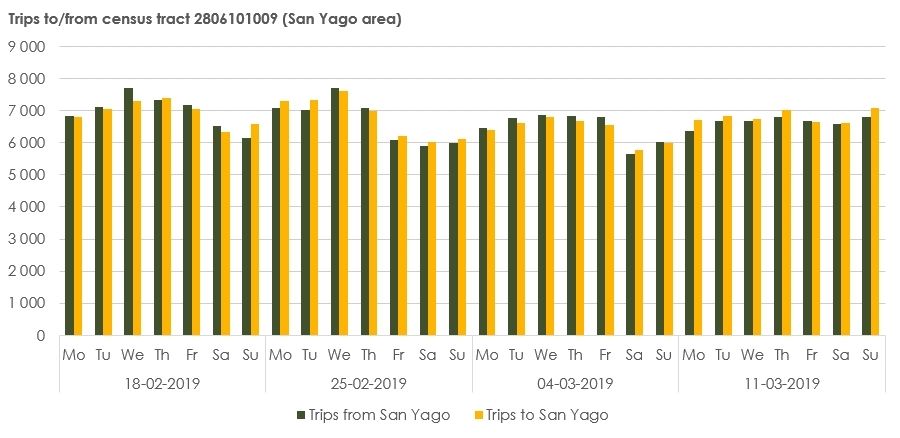
Is 352 daily passengers actually too low? In order to assess this, we have resorted to a series of daily OD matrices from mobile network data that register all the trips between census tracts within the Madrid region. The series covers four consecutive weeks in February-March 2019, a standard period before COVID-19 outbreak. The OD matrices were obtained with Nommon Mobility Analytics solution to exploit mobile network data. The large sample size offered by this source (around 20% of the population) enables a fine-grained analysis of trip generation and distribution patterns. As Figure 3 depicts, most of the area reachable within a 10-minute walk from the station falls within census tract ‘2806101009’, so we looked at the trips with origin or destination in this tract.
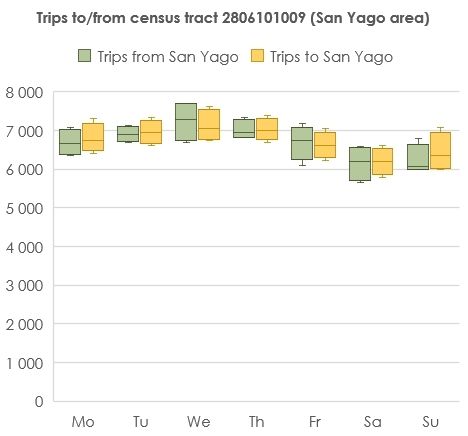
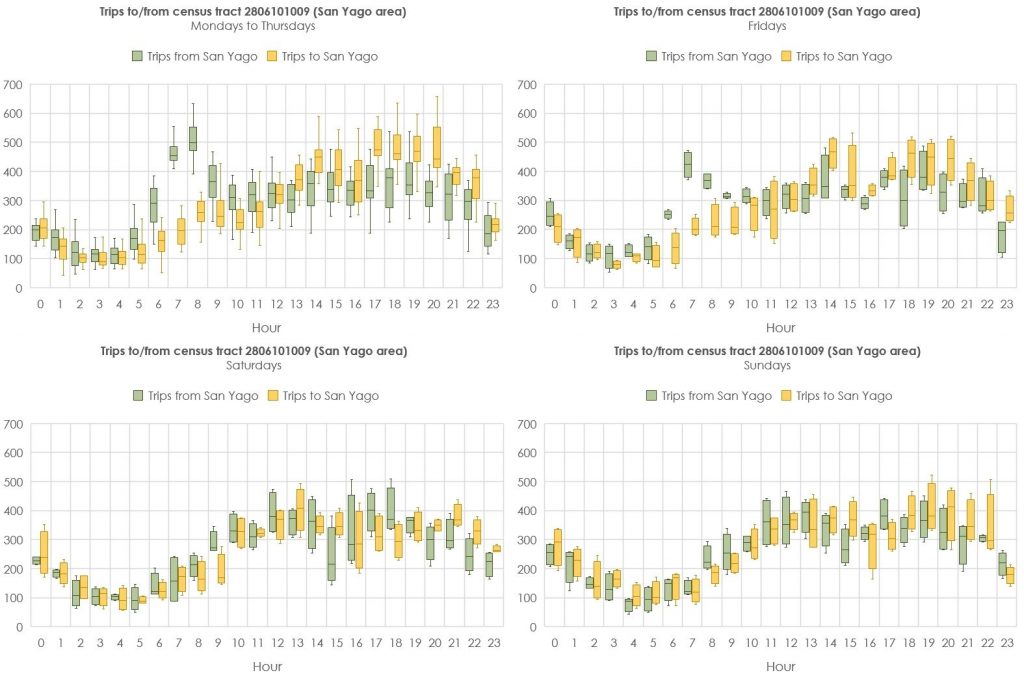
The OD matrices reveal that, on average, 13,500 daily trips are made with origin or destination in this area. Inflows and outflows are fairly balanced at daily level, with a similar number of trips starting and ending in the area every day. As it could be expected due to commuting flows, there is a noticeable weekly cycle in travel demand patterns: Saturdays and Sundays show the lowest number of trips. The last weekend of the series stands out as an outlier, as it did not experience a decrease in the number of trips as the previous weekends did. This different pattern may be related to the proximity of Saint Joseph’s Day on Tuesday 19th March 2019, which was a bank holiday. Figure 5 shows a box plot summarising the trip volume statistics at weekday level. Trip hourly distribution shows great differences between working days (Monday to Friday) and weekends (Figure 6). Working days are associated with a marked morning peak in trips starting in the area, lately compensated by reverse trips during the evening: a typical pattern associated with residential areas. Conversely, Saturday and Sunday do not show a specific peak. The information from the OD matrices (13,500 daily average number of trips starting or ending in San Yago) allows us to estimate that the passenger flow in San Yago accounts only for 2.6% of the overall mobility demand in the area.
A look at the trip distribution patterns in this area can shed light on the relatively low modal share achieved by commuter railway services. In order to be competitive, the alignment of public transport supply with the desired origins and destinations is key. We conducted a simple yet powerful analysis to seize the potential demand of this station: how many trips to/from San Yago actually start/end within a walking distance of another directly linked commuter railway station? To do so, we created a 750 metres spatial buffer around the stations connected to San Yago and checked which tracts are at least partially covered by the buffers (see Figure 7). Then, we looked at the trip volumes in those OD pairs between the San Yago census tract and the selected connected tracts.
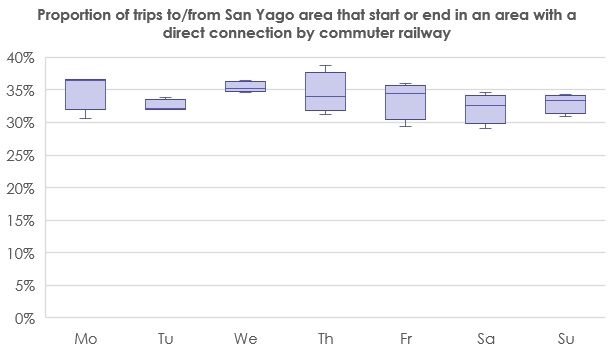
The results show that one third of the trips to/from San Yago are actually from/to areas with a direct railway connection. This sums up to an average of 4,500 daily trips. As Figure 8 shows, the proportion is rather stable throughout the week. If it is assumed that all San Yago passengers would start or end their trips in these areas, this means that the approximated modal share of the rail services among their potential demand is 7.7%. This is significantly higher than the proportion referred to the total number of trips to/from the area, but it is still arguably low.
It is interesting to see which modes of transport are being used instead of the railway services by the majority of travellers in the area. The 2018 Household Travel Survey conducted by the Madrid Transport Authority (CRTM) provides rich information on the mode choice patterns in the San Yago area and the reasons behind these choices. The survey data is available from the CRTM open data portal.
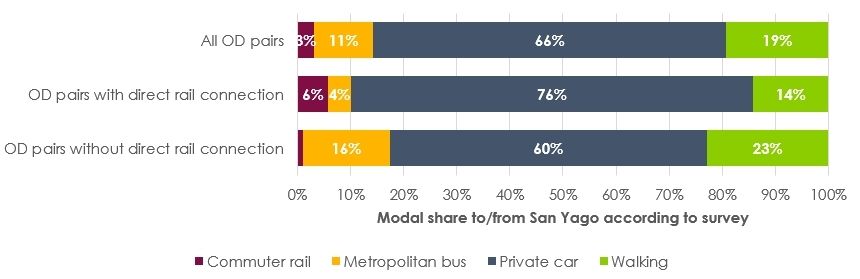
Taking as a reference those trips with origin or destination in the survey zone “061-001”, it can be seen that private cars dominate the mobility options chosen for travelling to the area. This mode accounts for two thirds of the trips starting or ending there, as can be seen in Figure 9. The prevalence of private car over other modes is even clearer in those OD pairs with direct commuter rail connectivity with San Yago (>75% car modal share). This is a typical pattern from suburban areas with low-density developments, where it is usually hard to maintain frequent public transport services that can compete with the flexibility offered by private cars [2]. It is worth mentioning two aspects these results:
- The survey validates the estimation provided above based on a fusion of mobile network data and ticketing data: according to the survey, 3% of the trips to/from San Yago are made using the railway services (estimated value: 2.6%). Similar values are also obtained for those OD pairs with a direct connection, 6% from the survey vs. 7.7% from ourestimation. The minor differences can be explained by the different study periods used in the sources and by the disparities in the zoning system of the survey data and the OD matrices from mobile network data used for this analysis.
- The survey shows that metropolitan buses manage to capture much more demand than railway services. These services benefit from the A-6 highway priority bus lanes to Madrid, which has been highlighted as a successful case study for the implementation of public transport priority measures [3]. Moreover, bus services are usually more frequent and more accessible than rail services, given the lower distance between stops.
Looking ahead: prospects for San Yago
Is San Yago destined to stay as the least used station in the network, or is there any hope that the demand figures will rise in the future? As no major urban developments are expected in the area, changes in the usage levels would likely come from interventions that make it more attractive for potential users. A common strategy is to broaden the catchment area of suburban rail stations through multimodal solutions. This makes the stations useful not only for those living or performing activities within walking distance, but also for other people travelling beyond. There are several actions that could contribute to this:
- Facilitate pedestrian and cycling access through dedicated infrastructure linking the station and the surrounding areas (e.g., the industrial area “Polígono 29”). Some users have already explained that this could be beneficial for the attractiveness of the station.
- Provide secure bicycle parking facilities in the station. There is abundant evidence on the potential of adequate bicycle parking supply for fostering commuter railway demand, as it reduces the access and egress travel times for those that can bike and live further away from the station.
- Improve the coordination with the metropolitan bus network. The modal split analysis reveals that commuter railway and metropolitan buses are complementary. Coordinated timetables between both modes may facilitate the access to the station, in particular for those who find it difficult to walk or bike in the last-mile.
Apart from interventions directly related to the station, actions in other parts of the network can also attract new users. For instance, the recently opened connection between Sol railway station and Gran Vía metro station has added a direct link between the railway line serving San Yago and the Madrid metro line 5. This enhanced connectivity has surely reduced travel times to some destinations in the inner city that require a transfer between the railway and the metro networks.
Conclusion
The combination of different mobility data sources has helped us analyse the least used station in the Madrid commuter railway system: San Yago. San Yago railway station serves around 350 daily passengers, which accounts for less than 3% of the trips with origin or destination in its catchment area. If only trips to/from the areas next to stations that are directly connected to San Yago are counted, the rail services are used by 7.7% of their potential demand. Survey data helped to validate these figures and reveal the mode choice patterns in the area. The analysis suggests that these services struggle to compete with private car. While it is hard for railway operators to sustain high frequency services to these areas, some actions can be made to facilitate the accessibility to the station (e.g., coordination with bus timetables, secure bicycle parking, quality walking and cycling itineraries). A close characterisation of travel demand patterns that takes advantage of the variety of available data sources is essential for making the right choices to this end.
Bibliography
[1] Observatorio del Ferrocarril de España (2021). “Informe anual 2019”.
[2] Alonso, A., Monzón, A., & Cascajo, R. (2018). Measuring negative synergies of urban sprawl and economic crisis over public transport efficiency: the case of Spain. International Regional Science Review, 41(5), 540-576.
[3] Finn, B., Heddebaut, O., Rabuel, S., van der Spek, D., & Brader, C. (2009). Buses with high level of service (BHLS)–Operational, regulatory and contractual dimensions.